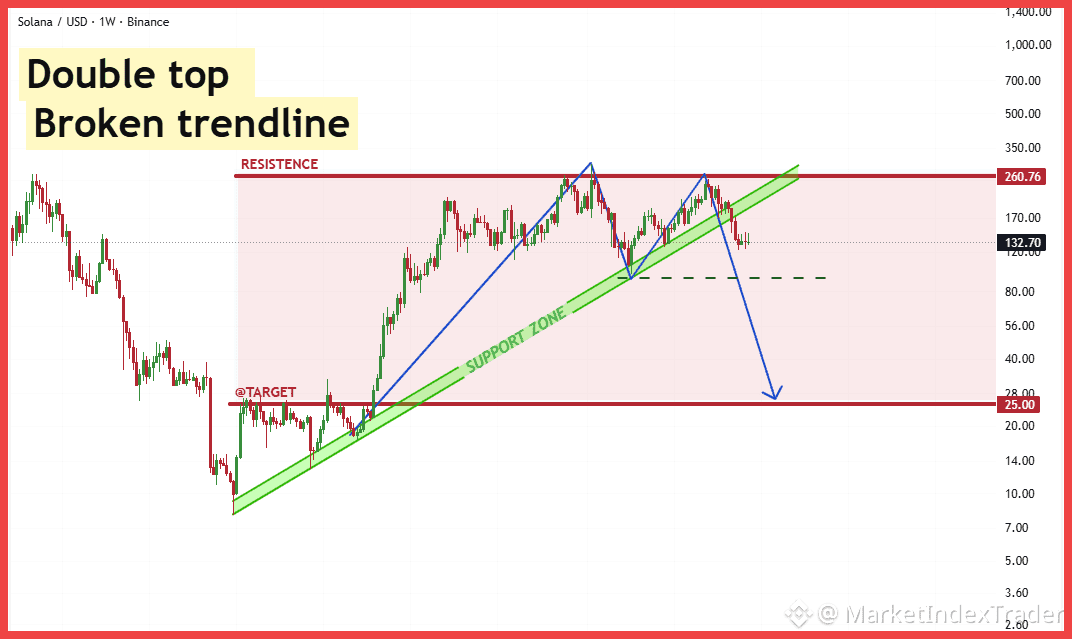
The weekly chart for $SOL gives a classic bearish signal: a confirmed double top pattern with a break of the long-term uptrend line. The next critical level is the neckline area at $100.
📊 Technical Analysis
The chart clearly shows the formation of a large double top with major resistance near $260. Most importantly, the long-term rising support line has been clearly broken.
The price is currently moving near the critical support area (neckline) between $100 – $110.
🔻 A weekly close below this level will confirm the entire bearish pattern, activating the theoretical target for the measured move which could reach the $25 area.
These structural signals must be respected on the larger time frame, as the risk level has become high.
🧠 Fundamental outlook
Although the technical picture seems negative, the fundamentals of the Solana network are still very strong and it is considered one of the best-performing Web3 systems.
Some of the main positive points:
Significant expansion in DeFi and stablecoins.
Ongoing developments on the network like Firedancer, which aims to improve stability and processing speed.
These factors indicate that the value and actual use of the network are still high, making any deep drop a long-term accumulation opportunity.
🧭 Action plan
For traders: extreme caution below the $110 level.
For long-term investors: any potential drop is seen as a wide accumulation opportunity.
Personally, I am gradually distributing spot buy orders between $40 and $100, focusing on a dollar-cost averaging (DCA) strategy rather than short-term trading.
✅ Overall recommendation: HOLD with gradual accumulation of SOL on the Binance platform.
💬 Tell us the name of the altcoin you are holding, and we will analyze it for you.
#SOL #Solana #التحليل_الفن #كريبتو

