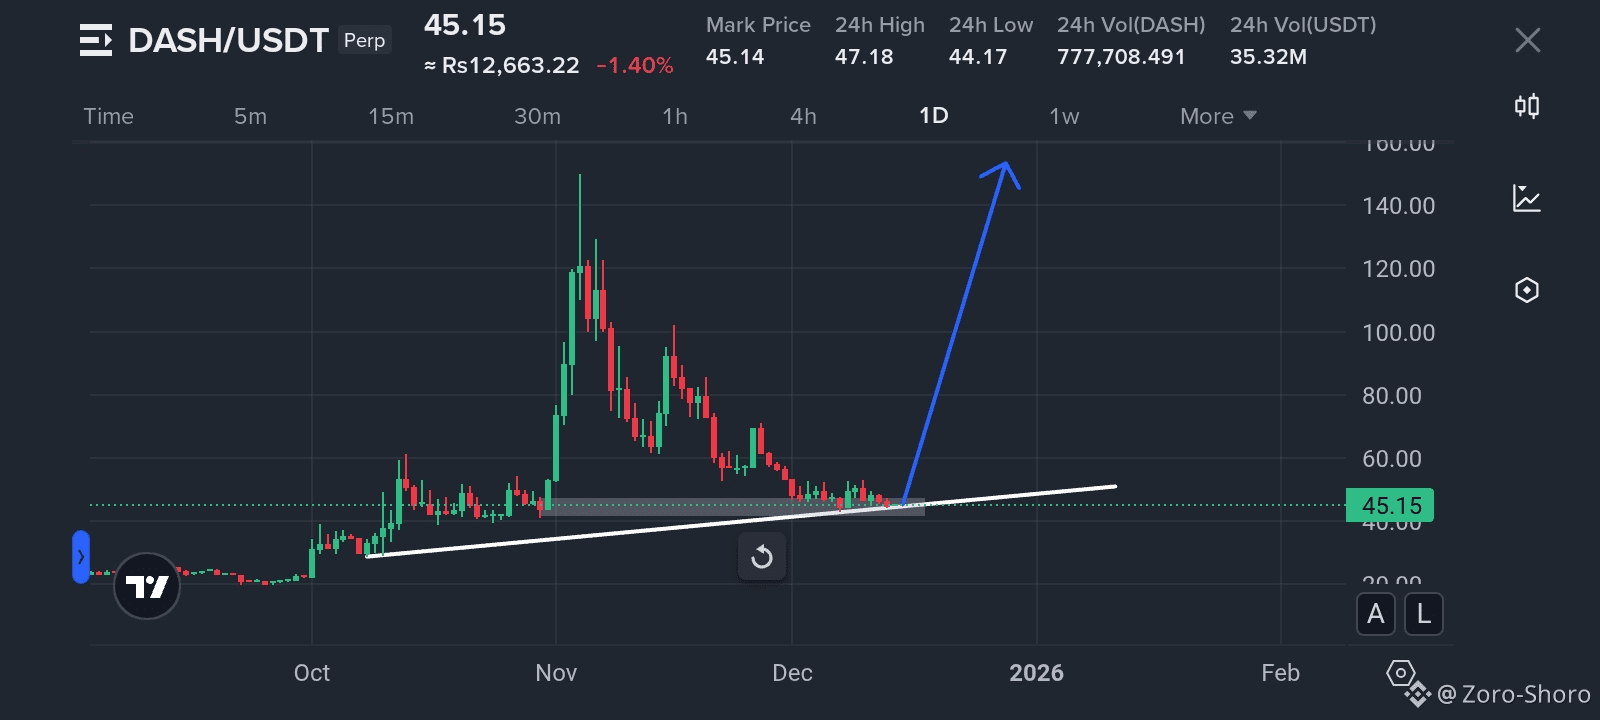
As shown in the attached image, price is currently reacting to a strong Daily (1D) timeframe trendline and a high-confluence demand zone between 41.24–47.67. This area is technically significant and can act as a major decision point for the market.
📈 Bullish Scenario
If price holds the Daily demand zone and the trendline, we can expect a bullish reaction.
In this case, price is likely to start forming higher lows and higher highs on the lower timeframe (typically 4H).
This structure shift could fuel the next upside move, with price targeting a new higher high near the $160 level, continuing the broader bullish trend.
📉 Bearish Scenario
If price breaks down and closes below the Daily demand zone, bullish structure will fail.
In that scenario, price may decline toward the next major Weekly demand zone between 28.60–38.94, which would act as the next potential support area.
Conclusion:
This is a clear and mechanical setup — price reaction at the Daily demand zone will determine the next major move.

If you have any questions or suggestions, feel free to drop them in the comments.