#PIEVERSEUSDT #NIGHTUSDT #PIPPINUSDT $PIEVERSE


# Analysis of the trading pair PIEVERSE-USDT
Time period: 2025-12-14 21:00:00 ~ 2025-12-15 08:00:00
Nature of the data: Real-time data
## Analysis of Japanese Candlestick Patterns
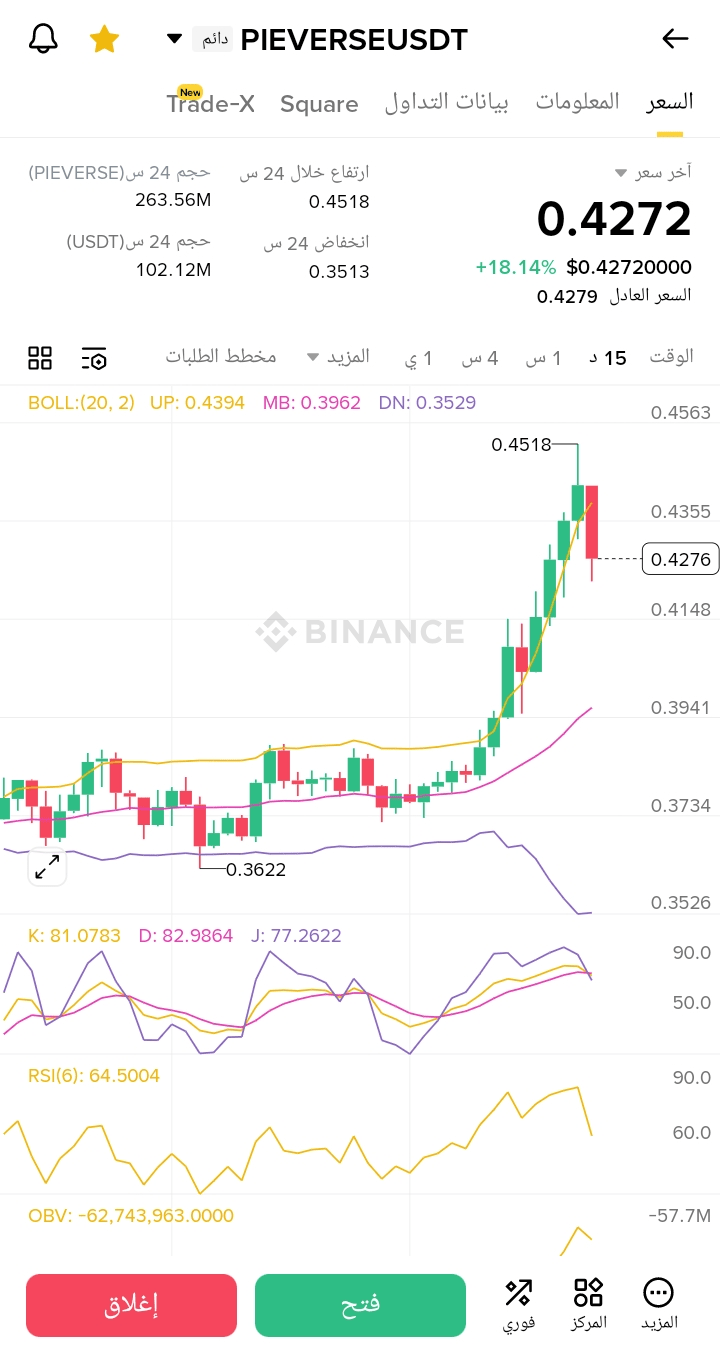
*Appearance of a consolidation pattern in the middle of the chart around the price 0.3750** - Signal of the end of the sideways trend - Medium strength signal
*Formation of a bullish breakout pattern after a consolidation period at 0.3957** - Strong bullish signal - Beginning of the uptrend
*A series of consecutive green candles (three white candles) around 0.4185** - Strong continuation of the bullish trend - Strong signal
*Long green candle at 0.4404** - Strong buying momentum - Strong bullish signal
*The last candle is red at 0.4259 after reaching the peak of 0.4524** - Profit-taking and potential correction - Medium warning signal
## Volume indicator analysis (VOL)
* Noticeable increase in trading volumes with the start of the bullish trend
* The highest trading volume coincides with strong green candles, confirming the strength of the bullish trend
* Trading volume in the last 24 hours reached 13.29 million USDT, indicating high interest in this pair
## Identifying support and resistance levels
*Main resistance**: 0.4524 (highest price recorded)
*Average resistance**: 0.4400 (potential correction area)
*Short-term support**: 0.4259 (current price which represents a correction after the rise)
*Average support**: 0.4000 (important psychological level)
*Strong support**: 0.3630 (previous support level before the bullish breakout)
## Overall technical assessment
*Volume and price coordination**: A clear correlation between increasing volumes and rising prices, confirming the validity of the bullish trend
*Overall trend direction ruling**: Strong bullish trend in the short term with the likelihood of a short-term correction
*Summary of signals**: Bullish signals significantly outweigh bearish signals, with a 16.96% increase in the last 24 hours
## Summary
The PIEVERSE-USDT pair shows a strong bullish trend supported by high trading volumes. The recent red candle may indicate a short-term correction after the rapid rise. Traders can consider:
1. Buy strategy on dips: Monitor specified support levels (especially 0.4000) for entry
2. Partial profit-taking: For those who entered early in the bullish trend
3. Setting stop-loss: below the level of 0.3630 to protect profits