In the crypto world, candlesticks can be drawn, news can be fabricated, but the flow of real money is always the trump card that major players cannot hide. My friends, I am Anna. I have just deeply analyzed the two 'heavyweight' charts you sent — one is the 4-hour candlestick of FOLKS, and the other is a bare flow of funds from major institutions. The conclusion excites me: the current market is staging a classic 'feint east, strike west' drama, and the slight price pullback is very likely digging a pit for the next move.
1. News analysis:
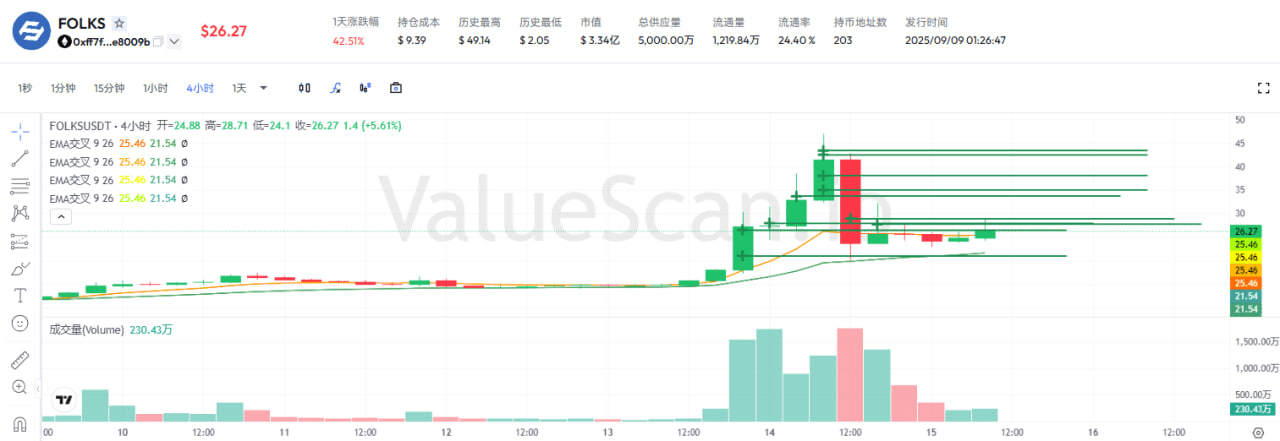
1. The price is stuck at 26.27. Although there was a daily increase of up to 42.5128.71 before retreating, this indicates that significant selling pressure was encountered as the price approached the previous high of $29 (the key resistance level we emphasized yesterday). More concerning are the technical signals: the chart clearly marks 'EMA crossover 9 26 25.46 21.54'. This usually indicates that the short-term moving average is crossing downwards, forming a 'death cross', which is a technical warning of weakening upward momentum and potential pullback. The trading volume is 2.3 million, which is relatively flat, suggesting that both bulls and bears are cautious here.
2. But if you only look at the candlestick chart, you might fall for the main force's trick. Please keep your eyes locked on the second 'Main institution capital flow table,' where the numbers will tell a completely different story. Let's look at it from a time dimension:
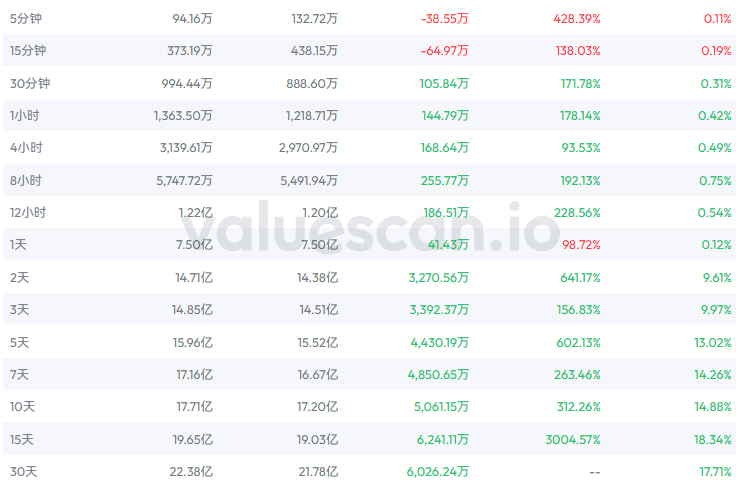
Short-term (5 minutes, 15 minutes): Net capital outflow of 385,500 and 649,700. This completely corresponds to the short-term price drop on the candlestick chart, which is an intuitive reflection of retail panic selling and the liquidation of short-term profit positions, creating panic in the market.
But from the mid-term to long-term (30 minutes to 30 days): The data is all in the green! All net capital inflows. Among them, several key cycle signals are strong:
2-day cycle: Net inflow of 32,705,600, with an increase of up to 641.17%! This is the strongest accumulation signal recently.
7-day cycle: Net inflow of 48,506,500.
30-day cycle: Net inflow of 60,262,400.
This reveals a core fact: Retail investors and small funds are fleeing in panic in the short term, while the main institutions are using every decline to steadily, systematically, and massively buy and accumulate chips. This is a typical 'washing' tactic: using small declines to scare off weak holders while they themselves hold steady below.
Anna’s view is very clear:
Do not be frightened by the 'dead cross' on the 4-hour chart and the short-term bearish candles. The current pullback is more like a proactive retreat to accumulate strength against the key pressure level of $29, with the aim of clearing floating chips. I have experienced too many cases where a certain token repeatedly shows 'dead crosses' and shrinking volume before key pressure levels, and the market is overwhelmingly bearish, but capital flows indicate that the main forces are frantically absorbing. The result is often that within one to two days, a long bullish candle directly breaks through the pressure level, starting the main upward wave, causing all those who missed out to regret. The current capital situation of FOLKS is highly similar to those classic cases before the night.
II. Technical analysis:
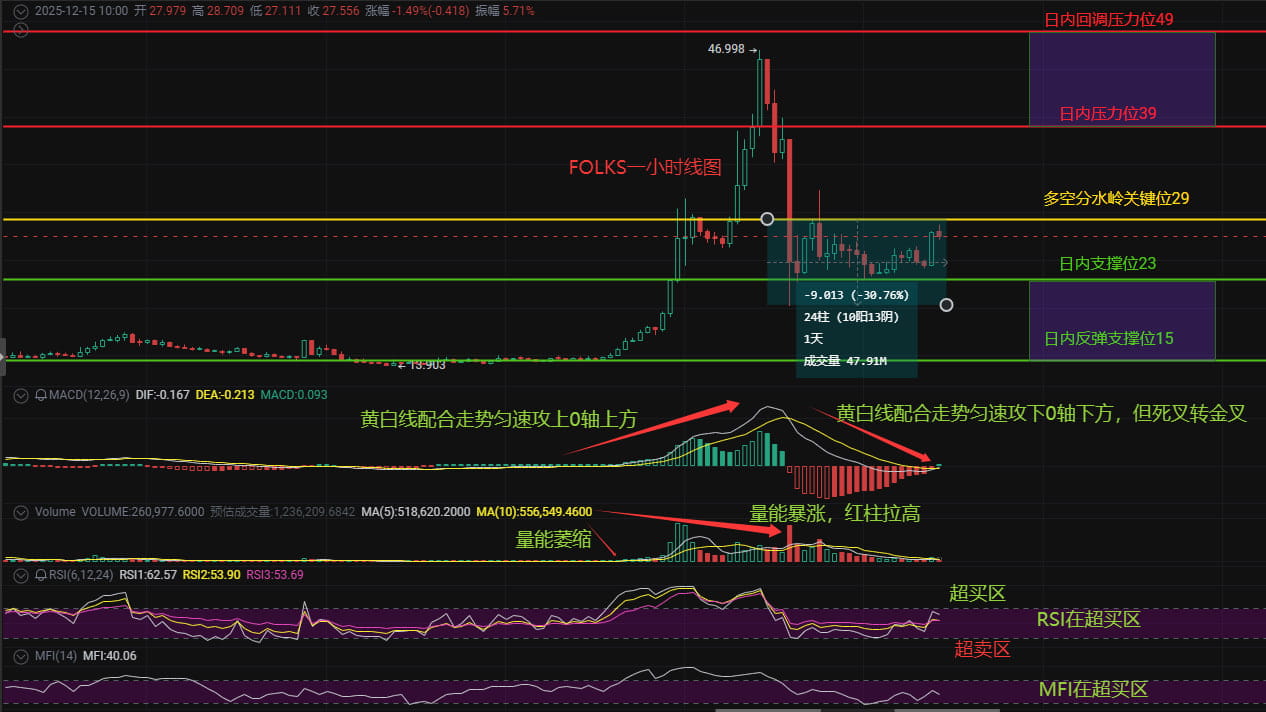
First, take a look at the latest situation on the board: the current price is hovering around 27.5, slightly down from yesterday, firmly pressed below the key level of 29. This is like a siege; the city gate (29) has been under siege for a long time, and morale (buying power) is likely to wane. Don’t be fooled by a small charge a few days ago, but as I often say, any rise without volume is just 'playing tricks.' The overall trading volume has shrunk severely, and that lonely red bar of increasing volume looks more like a 'don’t run, fellow' signal, which won't last.
Let me share my personal view: right now, this market is a typical battle between technical and emotional aspects. From the indicators:
MACD: The yellow and white lines (DIF and DEA) are still lying below the zero axis, although they haven't made new lows and there are signs of a 'dead cross turning golden cross,' indicating that the downward momentum is weakening. But it's like someone who just got over a fever wanting to be full of energy (strongly rising) immediately? Difficult!
RSI and MFI: One is at 62, the other is at 40, both marked in the 'overbought zone' on the chart. What signal does this reveal? Simply put, the buying power in the short term is a bit exhausted, and almost everyone who should buy has bought. If there is no new capital (increment) to take over, once the price is pulled up, it can easily attract profit-taking and selling. I’ve seen too many cases, such as a certain altcoin last month, where the RSI surged above 70 without accompanying volume, resulting in a hard pullback of 20% from the high point; the principle is the same.
Therefore, my judgment is very clear: today and in the next day or two, the main theme of FOLKS will revolve around the 'bull-bear dividing line' at 29, repeatedly contending. The upper levels of 39 and 49 are two heavy ceilings that cannot be touched without significant good news; the lower defense line is at 23, which is a short-term lifeline. If it breaks, the next station will need to look around 15.
Here’s some practical advice for our holders and observers:
Holder: No break below support at 23, long position target around 39, exit and pocket the profits, don’t be greedy.
Observers: Chasing high now is like taking a risk in a fire. First, there needs to be a noticeable support rebound signal as it stabilizes around 23; second, a strong breakthrough of 29 with volume and stability to replenish positions. The market is not short of opportunities; what it lacks is capital.
Want to know the specific entry point and where to set the stop-loss most safely? Anna's camp has already provided reminders; those who want to follow, pay attention to@南安娜sol Become a member of Anna's camp!
In summary, the script of FOLKS has shifted from simple technical games to a new phase dominated by 'capital.' Short-term price fluctuations are a fog, while sustained net capital inflows in the medium to long term are the lighthouse. So, the ultimate soul-searching question comes: When the technical indicators of the candlestick chart diverge from the real flow of main capital, do you choose to believe those easily drawn lines, or do you choose to believe the data backed by tens of millions in real money? Follow @南安娜sol as we penetrate the fog together, follow the funds, and seek certainty. If you don’t know the specific entry timing and exit points, become a member of Anna's camp, and Anna will announce the daily currencies and entry/exit points in Anna's camp 24/7.