
The shooting formation is formed when the open low, and close are roughly the same price, this candle is characterized by a small body and a long upper shadow. It is the bearish version of the hammer.
Professional technicians say that the shadow should be twice the length of the real body.
See the example below:
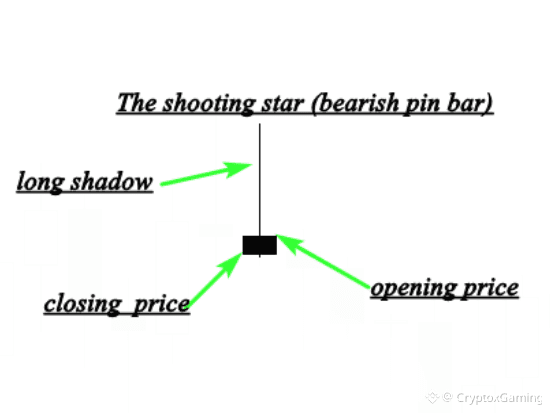
The illustration above shows us a perfect shooting star with a real small body and an upper long shadow, when this pattern occurs in an uptrend; it indicates a bearish reversal signal.
The psychology behind the formation of this pattern is that buyers try to push the market higher, but they got rejected by a selling pressure.
When this candlestick forms near a resistance level. It should be taken as a high probability setup.
See another example below:
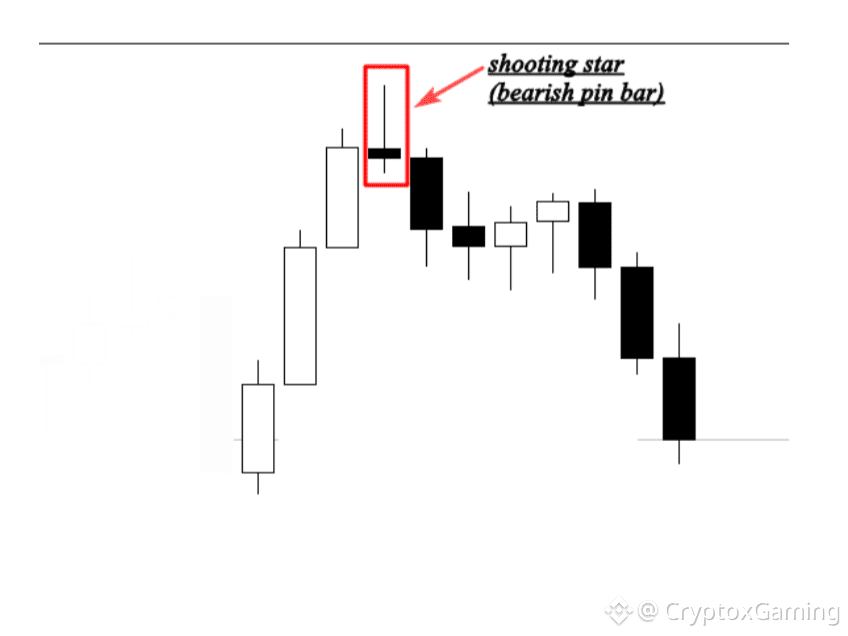
The chart above shows a nice shooting star at the end of an uptrend.
The formation of this pattern indicates the end of the uptrend move, and the beginning of a new downtrend.
This candlestick pattern can be used with support and resistance, supply and demand areas, and with technical indicators.
The shooting star is very easy to identify, and it is very profitable, it is one of the most powerful signals that i use to enter the market.
In the next chapters, i will talk about it in details, and i will show you step by step how to make money trading this price action pattern.
