Bitcoin BTC's accurate prediction for December 16 is to drop to 87582, has the decline ended? Can we buy the dip? Has it started to rise again? Go left, go right?

1. Learning notes on Bitcoin BTC
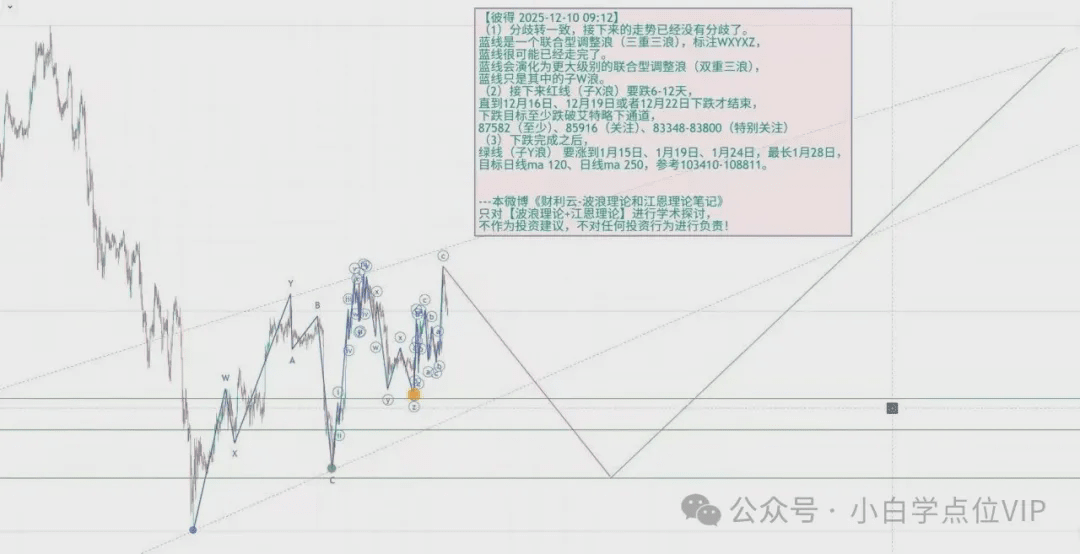
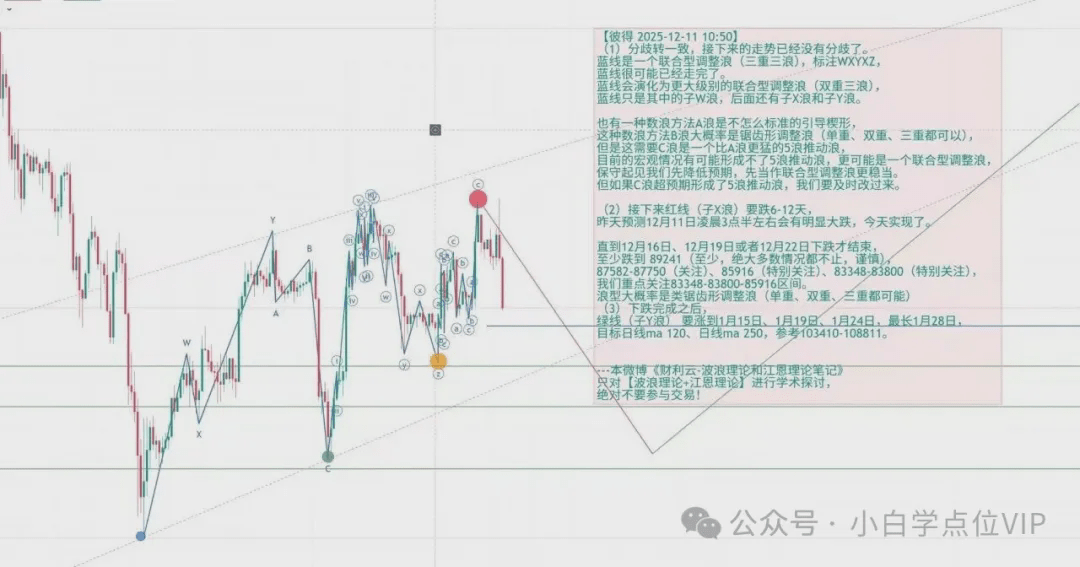
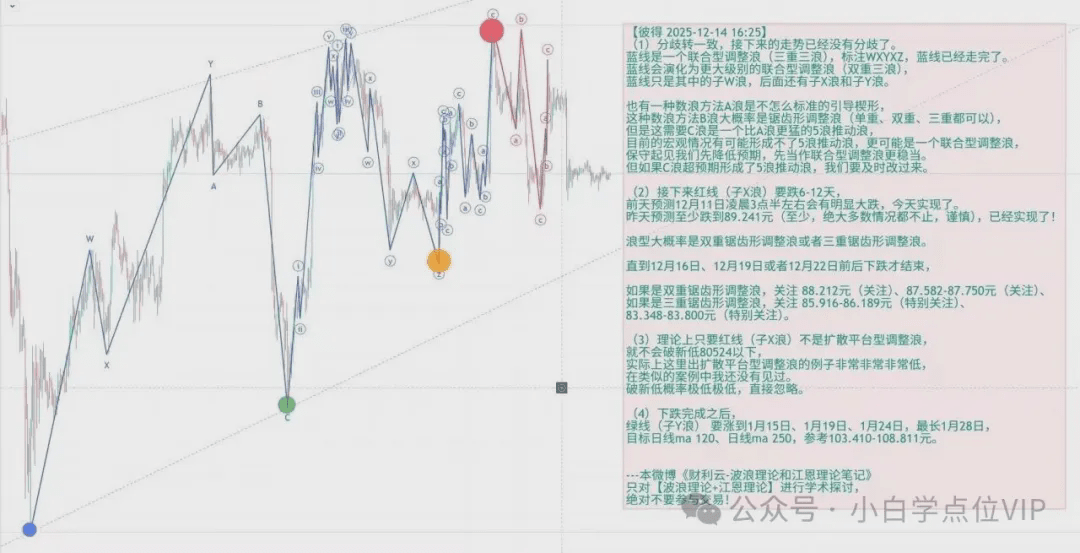
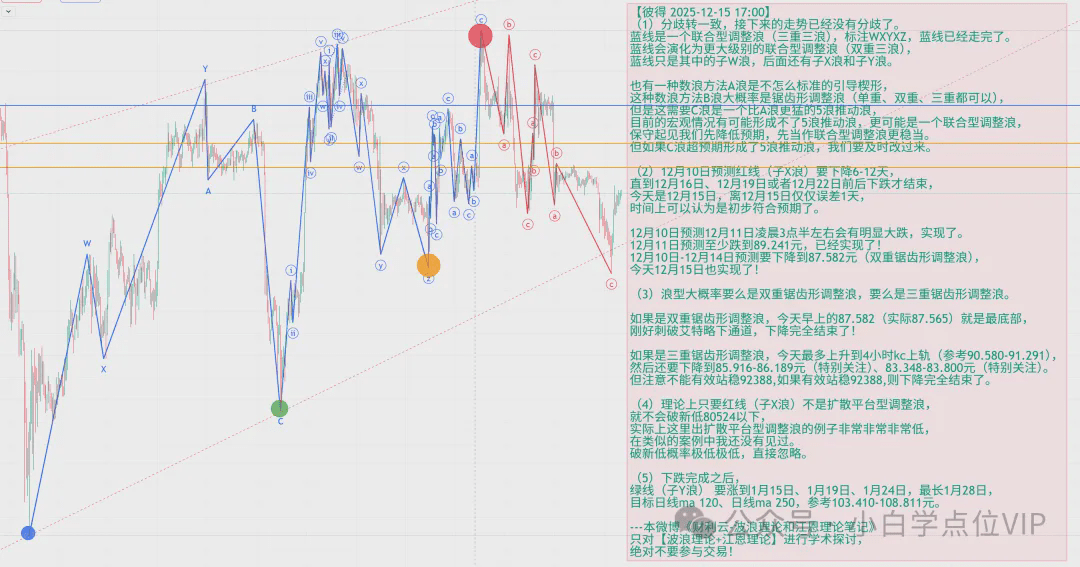
1. Wave theory notes
Recently, our analysis of BTC has been eerily accurate, with daily analyses being correct!
The prediction for December 10 was that there would be a significant drop around 3:30 AM on December 11, dropping at least to 87.582, and it has been realized until today!
The prediction for December 11 is to fall at least to 89.241 (at least, in most cases, it's more than that, be cautious), and it has been realized!
The prediction for December 14 was that if it is a double zigzag correction wave, it should drop to 87.582-87.750, and it has been realized!
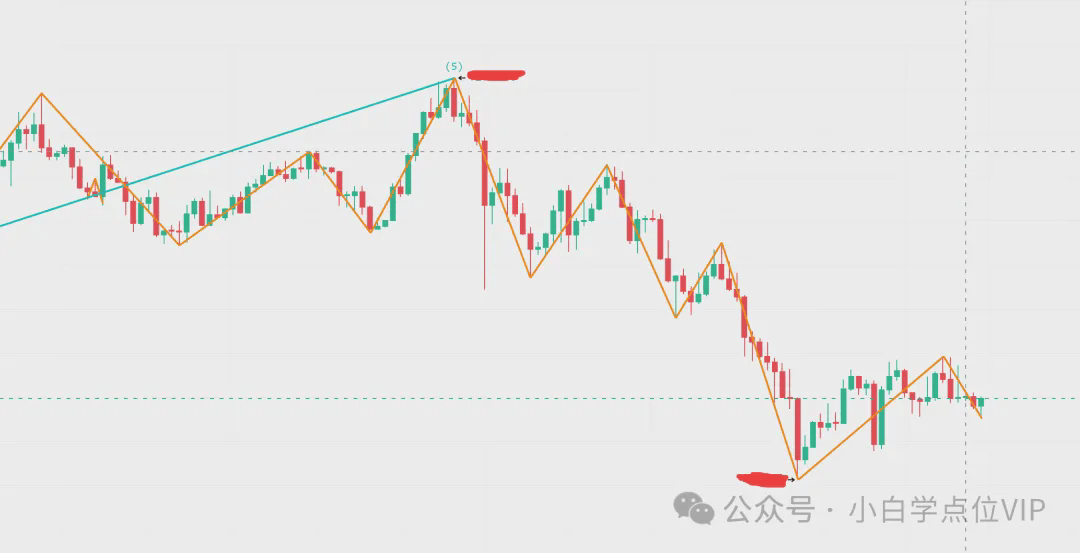
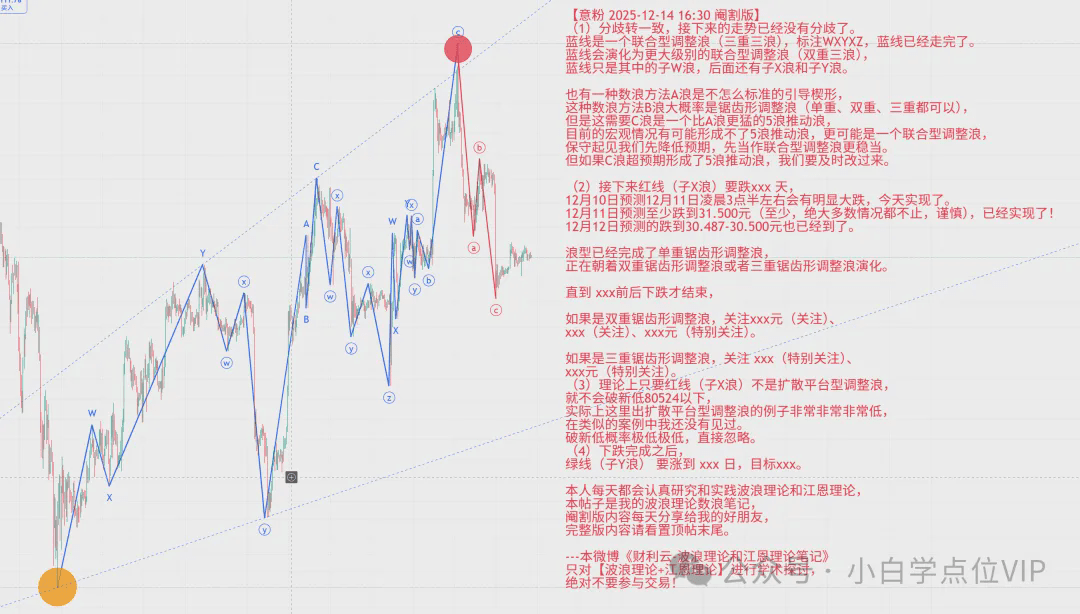
On the morning of December 15, it was pointed out that [87.582 has been reached, the decline has ended with potential for rising, and the rise may start at any time! But if the rise has not ended, it will further evolve into a triple zigzag adjustment wave.]

The latest wave analysis chart is as follows, please take a serious look:
2. Notes on Gann theory
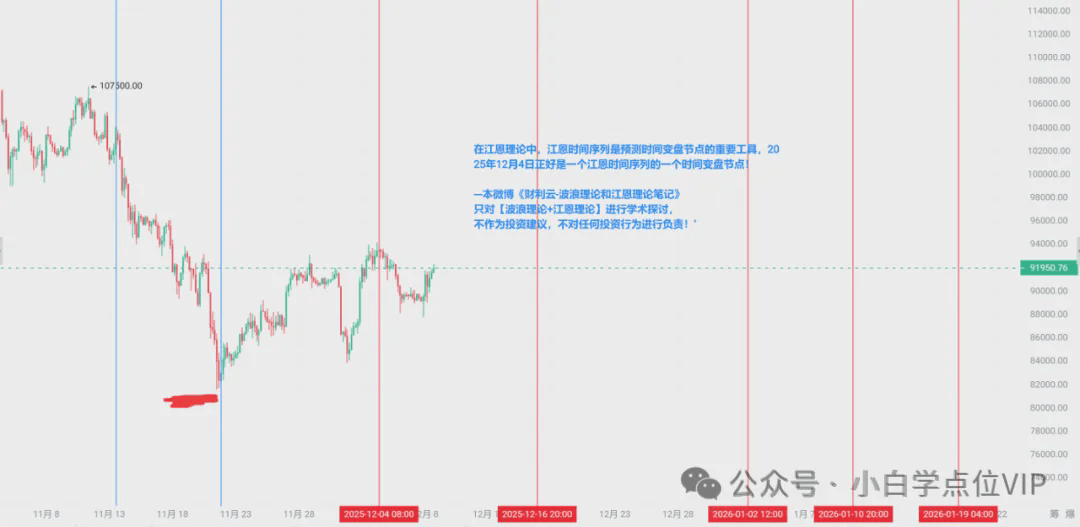
(1) Gann time series
We take the historical peak point on October 6, 2025, and the low point on October 11 as reference points to redraw the latest [Gann time series].
The next important reversal time nodes are on December 4, 2025 (verified), December 16, 2025 (verified), January 2, 2026, January 10, 2026, and January 19, 2026.
(2) Gann box
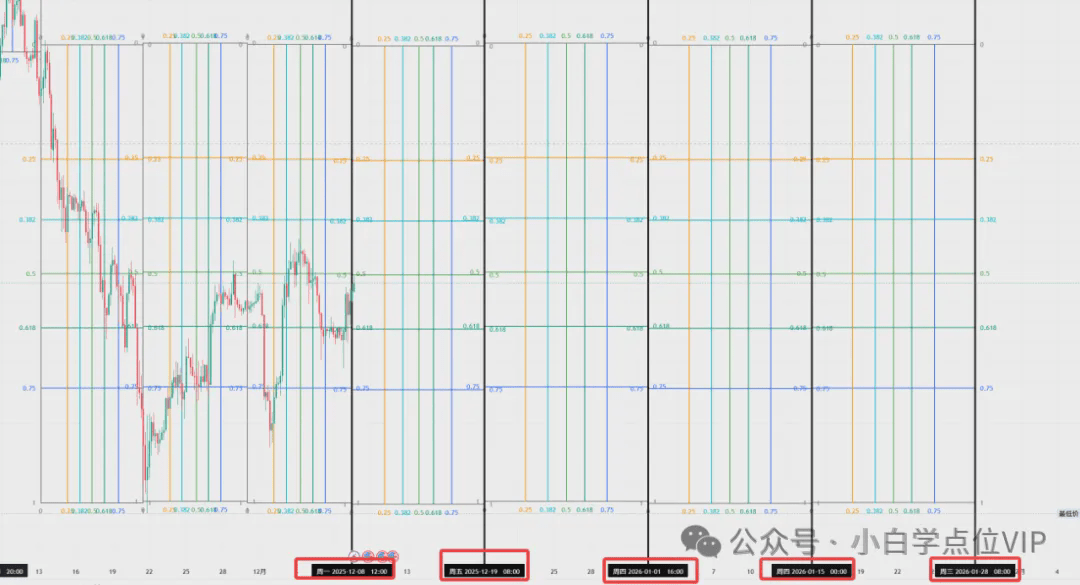
We take the historical peak point on October 6, 2025, and the low point on October 17 as reference points to redraw the latest [Gann box].
The next important reversal time nodes are on December 8, 2025 (verified, a small level turning peak), December 19, 2025, January 1, 2026, January 15, 2026, and January 28, 2026.
(3) Gann angle line
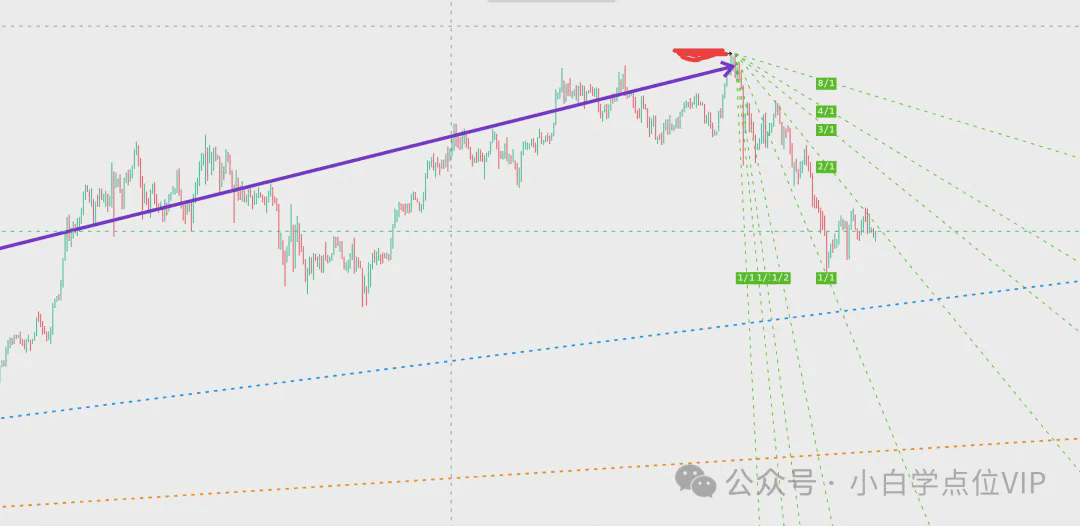
In the short term, pay attention to the pressure from the green Gann angle line. Last week a bottleneck appeared at the 1/2 angle line, and after the peak is reached, it needs to continue to rise to the 1/4 or 1/8 angle line.
[Stage resistance] Pay attention to the resistance of the blue Gann angle line.
[Real bear market resistance] The long-term focus on the orange Gann angle line in the bear market from September to October 2026 will see true major resistance!
3. Notes on cyclical theory
It is necessary to wait for the formation of a new daily level of cyclical theory central point before a major upward movement can occur (about to form).
4. Wyckoff notes
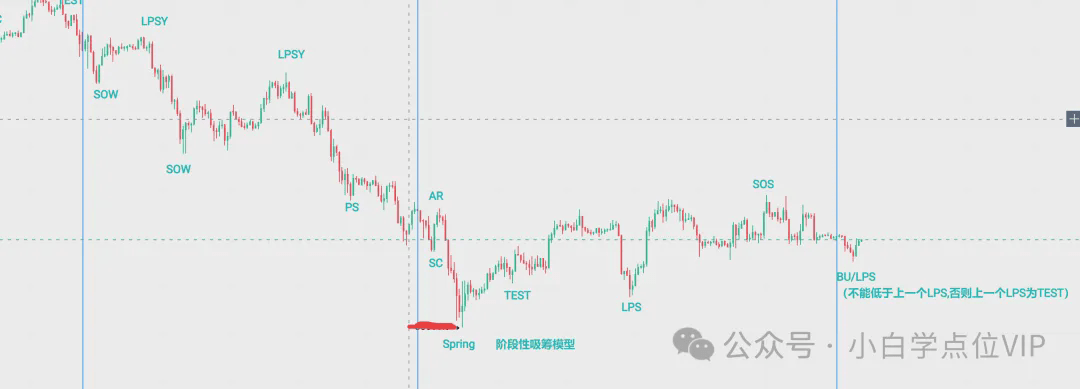
SOS peak has been validated;
BU/LPS cannot be lower than the previous LPS, otherwise the previous LPS is a TEST.
5. On-chain data notes
(1) Real whale holding amount - unspent balance
(2) [Short-term trader profit ratio]
6. Advanced reversal indicator notes
The first wave of rise has ended and has been validated: daily level MACD (8, 15, 6) dead cross, daily stochastic RSI and daily SKDJ sustained dead cross for more than 3 days, daily CCI rising to around 100 or above, DMI indicator's PDI crossing below MDI or PDI continuously staying below MDI with increasing amplitude.
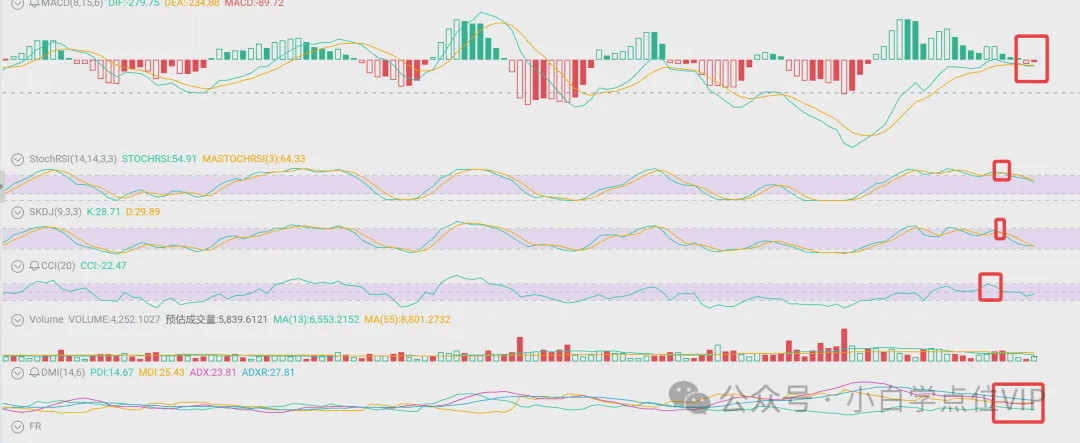
After the subsequent decline, there will be a second wave (the last wave) of upward movement. The confirmation signs for the second wave of rise are: 12-hour level MACD (8, 15, 6) golden cross, daily level MACD (8, 15, 6) golden cross, daily stochastic RSI and daily SKDJ sustained golden cross for more than 3 days, daily CCI dropping to around -100 or below, or showing a bottom divergence, DMI indicator's PDI crossing above MDI or PDI continuously staying below MDI with decreasing amplitude.
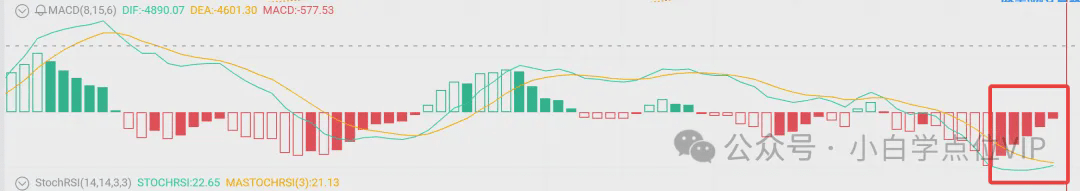
During a major upward trend, the 5-day MACD (8, 15, 6) will definitely show a golden cross. Just wait for the golden cross.
2. Learning notes on Ethereum ETH
Our analysis of Ethereum ETH is as accurate as a demon, and every day's analysis is correct!
3. Learning notes on SOL
Our analysis of SOL is as accurate as a demon, and every day's analysis is correct!

4. Learning notes on ZEC
Our analysis of ZEC is as accurate as a demon, and our analysis is all correct! Combined analysis, we have also done everything right!

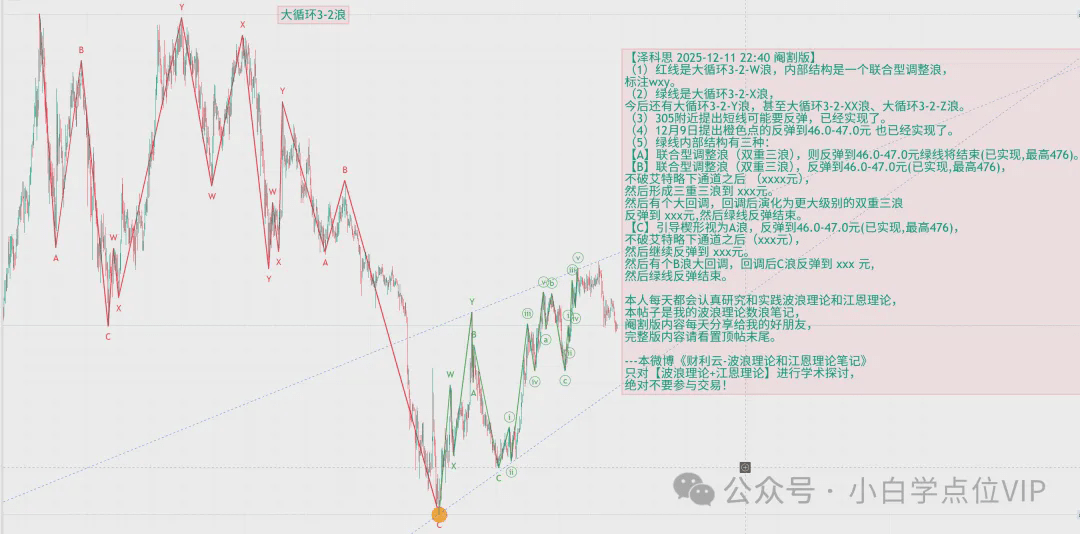
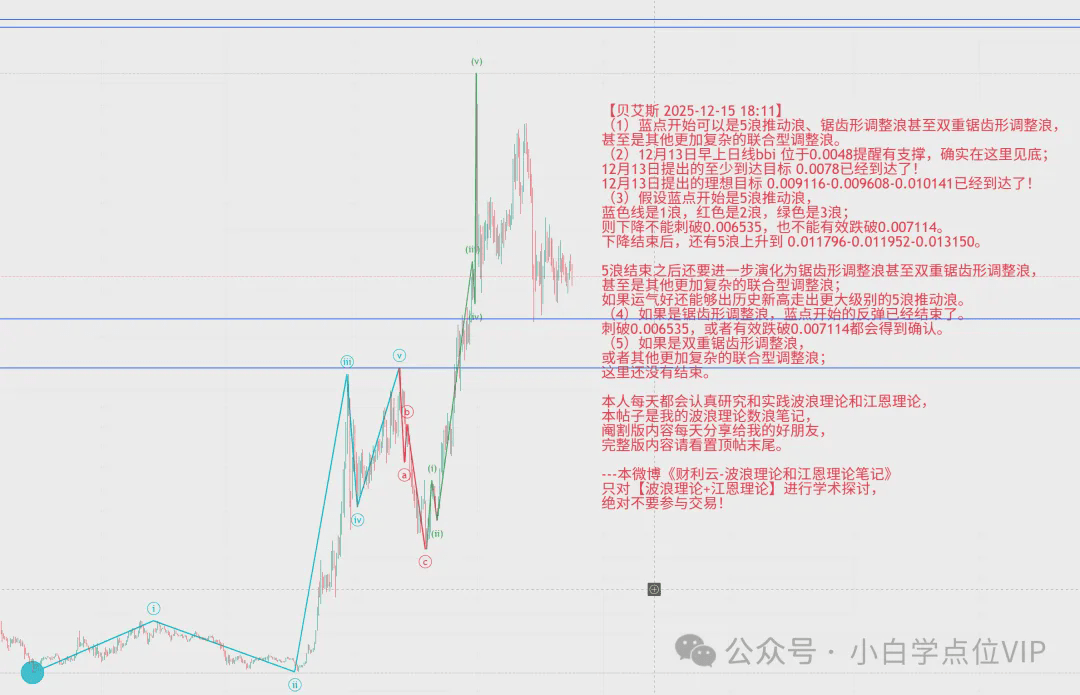
5. Learning notes on BAS
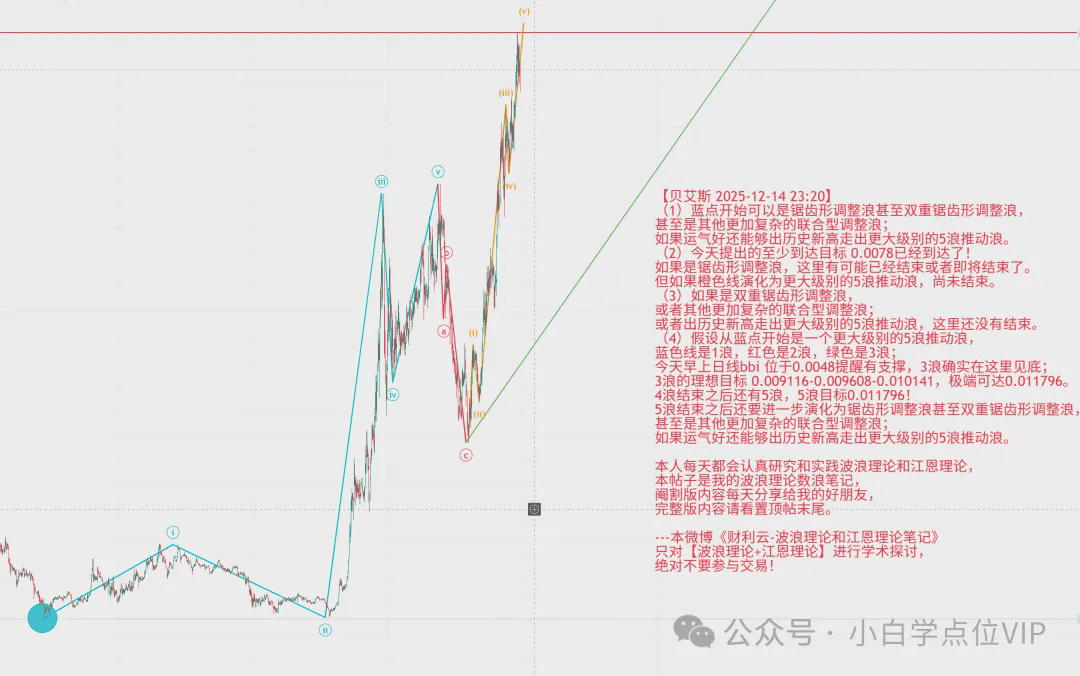
Our analysis of BAS is as accurate as a demon, and our analysis is all correct! Combined analysis, we have also done everything right!


The latest wave analysis chart is as follows:
6. Announcing the top ten warriors
I also want to become a big blue, and my top ten warriors will be announced then!

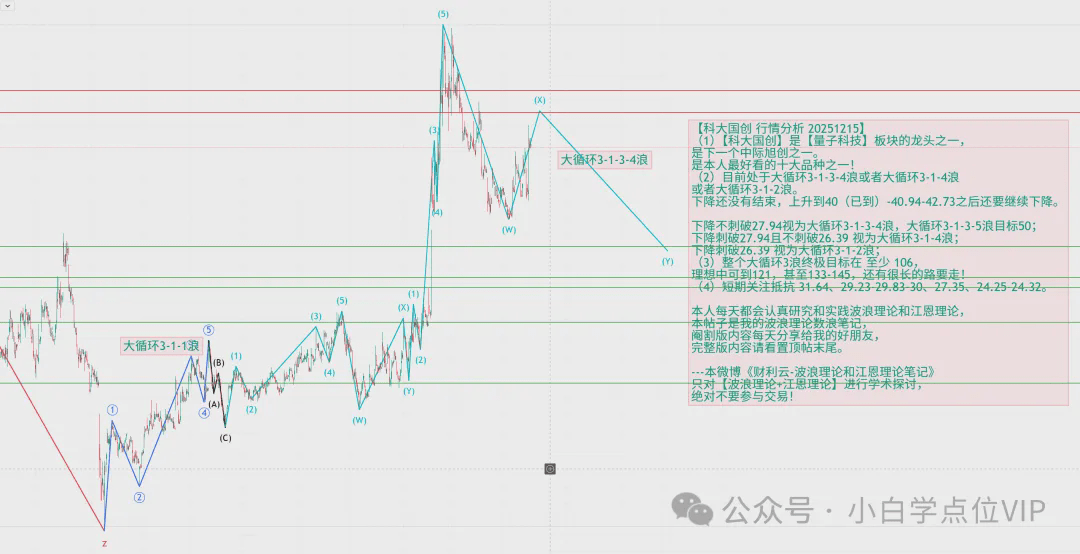
7. Learning notes on Keda Guochuang
Keda Guochuang is one of my top ten fish, shrimp, and crabs that I am most optimistic about!
8. Learning notes on A-shares Big A


The chaotic period of Big A will only end after the Spring Festival, or around the Spring Festival.
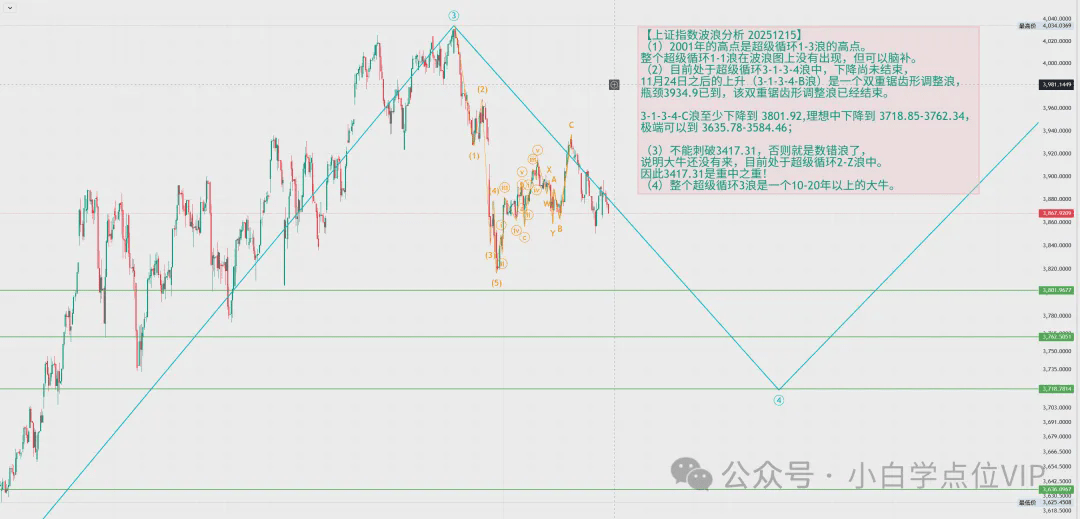
(1) The peak in 2001 is the peak of super cycle 1-3 wave.
The entire super cycle 1-1 wave has not appeared in the wave chart, but can be imagined.
(2) Currently in super cycle 3-1-3-4 wave, the decline has not ended,
The rise after November 24 is a double zigzag adjustment wave (3-1-3-4-B wave).
Bottleneck 3934.9 has been reached, this double zigzag adjustment wave has ended.
3-1-3-4-C wave will at least decline to 3801.92, ideally decline to 3718.85-3762.34.
Extremes can reach 3635.78-3584.46;
(3) Cannot break through 3417.31, otherwise it will be considered a mistake in wave counting.
This indicates that the big bull market has not yet arrived, currently in a super cycle 2-Z wave.
Therefore, 3417.31 is crucial!
(4) The entire super cycle 3 wave is a major bull market lasting 10-20 years.
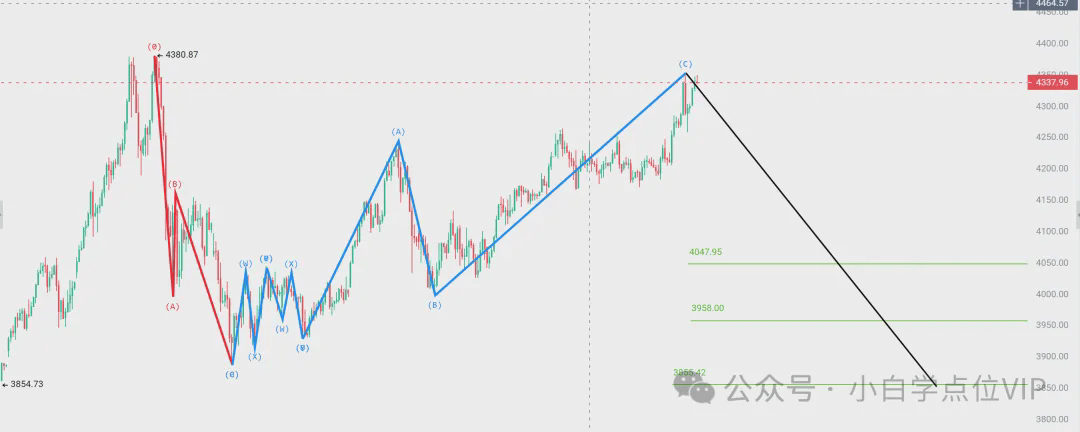
9. Learning notes on gold and London gold
There are serious discrepancies!
(1) Wave counting method one:
This is a double top, the decline after October 21 is a zigzag adjustment wave or a combined adjustment wave. In the short term, it will continue to decline to 4047.95, 3958, 3855.42.
(2) Wave counting method two:
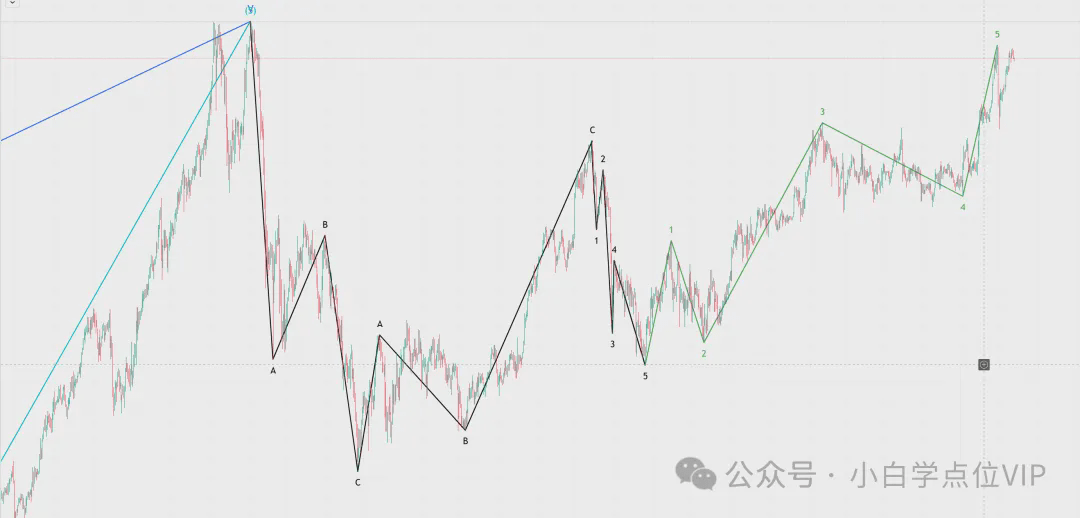
The black line is a platform-type adjustment wave, the green line is a 5-wave driving wave, and a new rise has begun.
Specifically which type, we need to track further!
11. To forge iron, one must be strong oneself
Having been in the industry for 13 years, as the master of the beginner's school of point learning, I am a practitioner of [wave theory, Gann theory, cyclical theory, and Wyckoff's trend indicators data analysis, proficient in on-chain whale data, ahead of others in understanding whale and trend movements, and proficient in advanced reversal indicator analysis], the originator of high win-rate trading models, creator of BBI + KC reversal channel line, creator of DC cycle, supplemented by CCI advanced trend lines, improved Fibonacci fan-shaped fitting speed resistance lines, exploring a sustainable path of continuous profit!
To forge iron, one must be strong oneself; only by enhancing one's understanding can one successfully navigate through bull and bear markets. We emphasize the sharing of knowledge, cultivating independent thinking, learning and accumulating in a bear market, and becoming someone else's dream in a bull market. We welcome like-minded individuals who identify with the values of the 'beginner's school of point learning' and are willing to learn and cultivate independent thinking abilities; only when you transform this knowledge and skill into your own accumulation can you possess the ability to think independently and avoid becoming a mere follower!
Disclaimer: This article only conducts academic discussions on [wave theory + Gann theory], not as investment advice, and does not take responsibility for any investment behavior!
Creating articles is not easy; reading an article only takes a few minutes, while writing an article takes several hours. If you agree with our community, please give a thumbs up and a like below, and comment and share more! Your support is my motivation for creating!
👉 ✅ Like ❤️, ✅ Follow ⭐, ✅ Comment 💬, ✅ Share 📤 Every interaction is a two-way journey! Come to the comment section and interact with me, let’s become better together! 💫