From Meow Meow (Trend Master)
There is an old saying in the market: A good buyer is an apprentice, but a good seller is a master. Indeed, discovering trends and entering the market after a breakout is not that remarkable; in fact, most people can identify the breakout points after gaining a certain understanding of market trends. However, those who buy in at the beginning often sell off too soon during the upward trend. I don't want to tell you how difficult it is to buy back the goods that were sold off too early at the right time. Knowing when to take profits appropriately is a test of a trader's skill.
Next, I will introduce some common take profit methods. However, it is important to note that these methods all have their limitations. Remember that there is no 100% accurate method in the market. If you can capture 70% of a strong trend, that's already very good! Taking profits is not a science, but an experience!
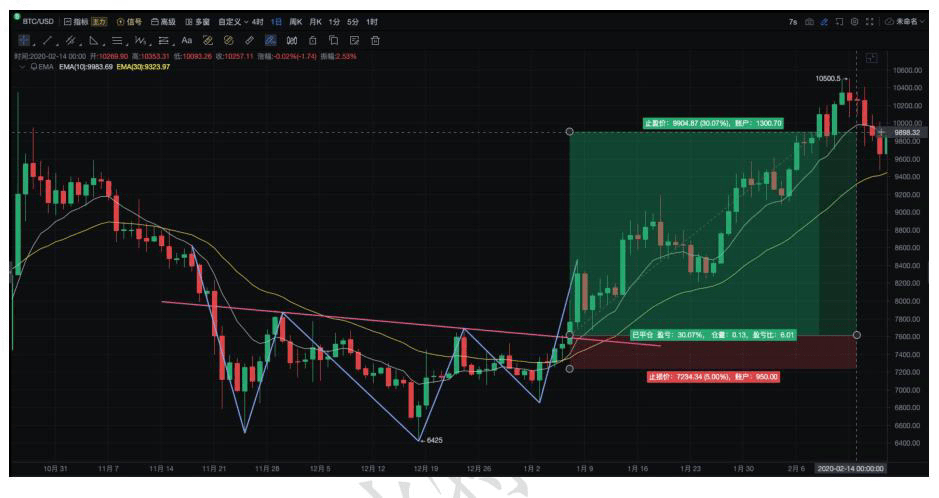
6.1 Take profit at expected target
Assuming you entered a long position after the head and shoulders bottom pattern broke the neckline, set a stop loss at 5% down and an expected target of 30% up, making the risk-reward ratio 6:1 (the risk-reward ratio should generally reach at least 3:1). Once the market price reaches your set target price, you can take all or part of your profits. Although this method cannot capture the entire upward movement, as long as the risk-reward ratio is reasonable, continuously accumulating profits through repeated actions can eventually lead to considerable wealth! This take profit method is simple and easy to understand, and it is one of my commonly used take profit methods, highly recommended for readers to use!
6.2 Moving average take profit
The moving average is an important tool for tracking market trends. Many people are likely familiar with its basic applications. When a strong trend is underway, it often moves steadily along a specific moving average. Each time it approaches the moving average, it continues to advance in the original direction. When the moving average is broken, it indicates that the movement is hindered, and it's time to take profits. As shown in the figure below: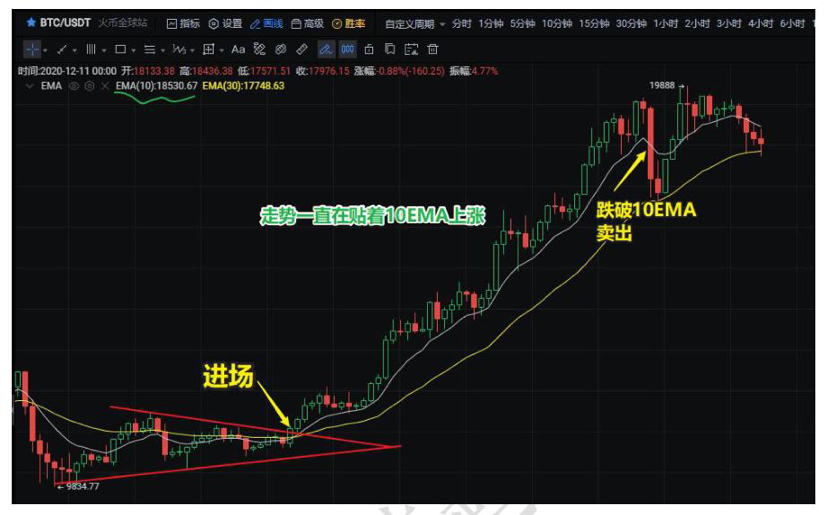
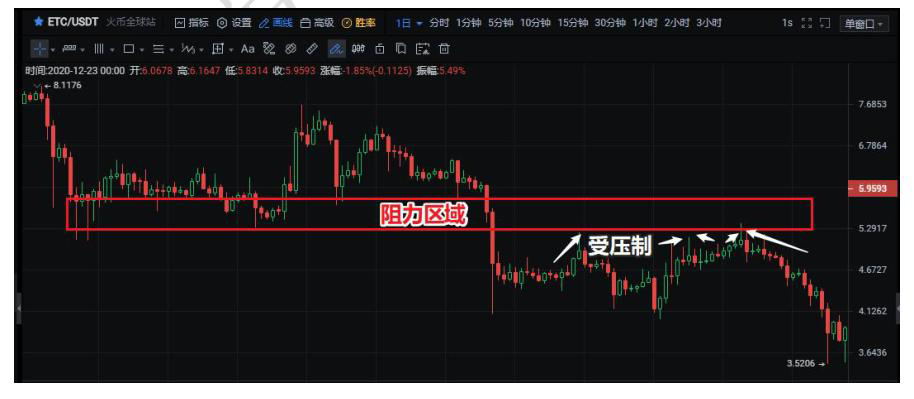
6.3 Key resistance level take profit
During the market's upward movement, encountering previous trapped areas can create pressure, and while this pressure exists, it can sometimes cause the upward movement to pause.
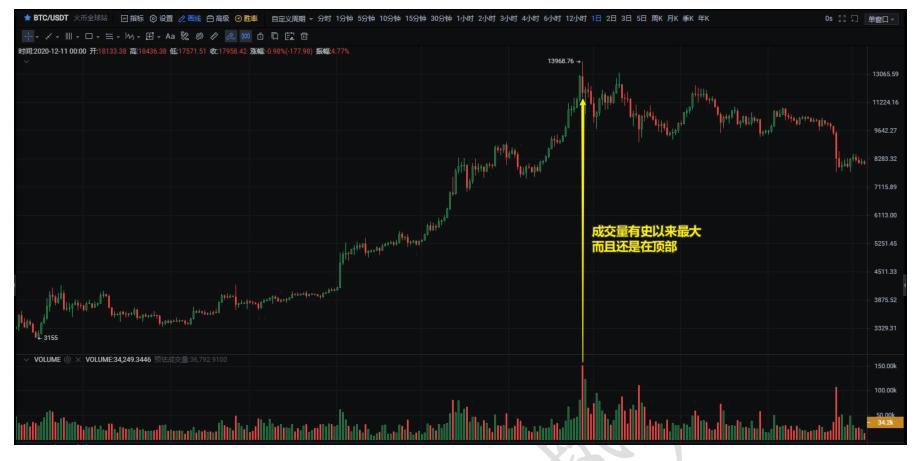
6.4 Volume-price divergence take profit
In an uptrend, if there is a volume that is larger than before, but the length of the K-line is not longer than before, it indicates a divergence between volume and price.
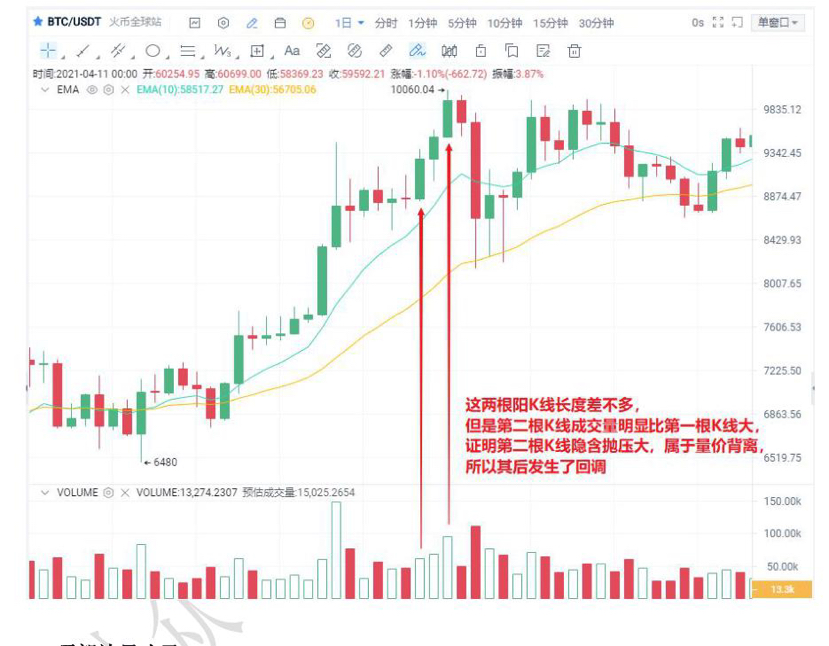
The market is always volatile. Sometimes, when the trend approaches the top, the trading volume is often unusually large, while the price hardly increases, or there is a sudden surge of a large bullish candle. In any case, unusually large trading volume is a sign of selling, which is often caused by the market accelerating towards the peak. After this, the market is mostly either in a consolidation phase or simply reverses. Pay attention to this phenomenon, and when encountering such a situation, take some profits.
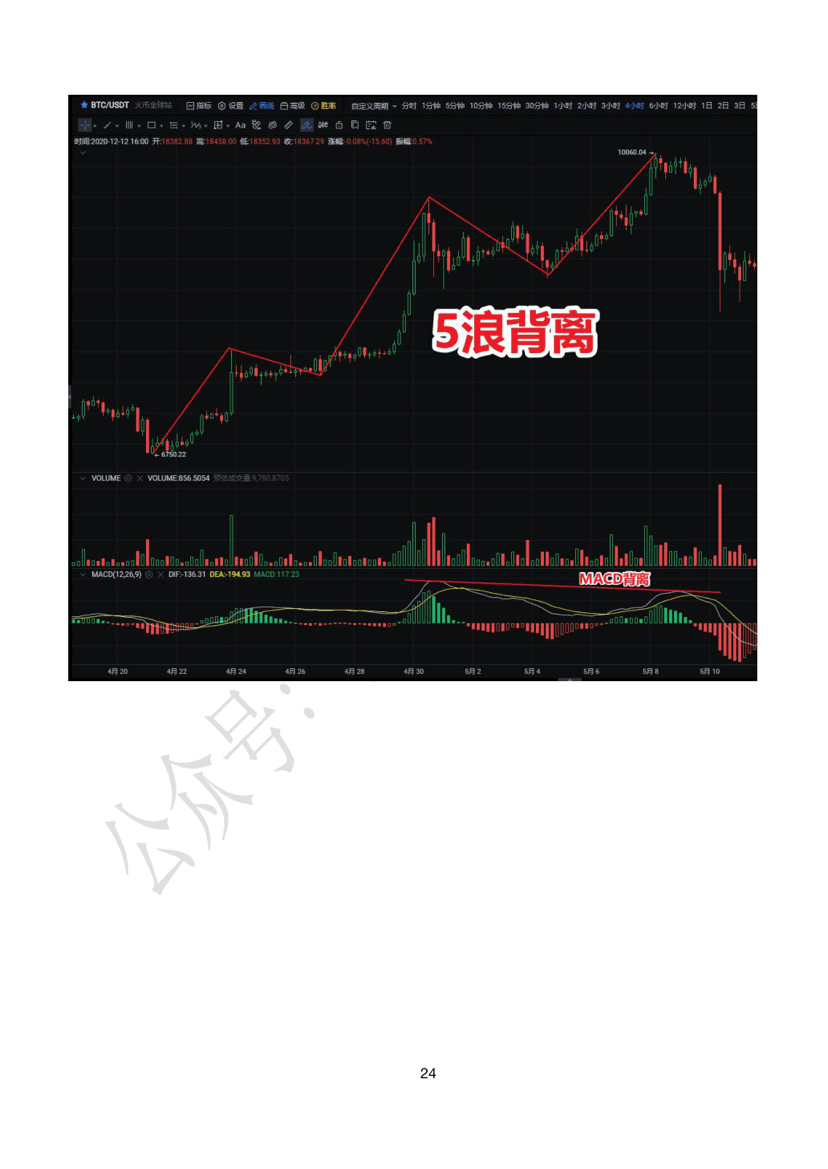
6.6 Five-wave MACD divergence take profit
As I said, there are indeed too many take profit methods. This method is based on my observations in the market. In a typical market, after three waves of upward movement, if the last wave shows signs of MACD divergence compared to the previous wave, it indicates that the upward momentum has weakened, and it's time to take some profits! As shown in the figure below:
6.7 2B rule take profit
In an uptrend, if the price has crossed the previous high but failed to sustain an upward push, and then later falls below the previous high, the trend is likely to reverse. In a downtrend, if the price has crossed the previous low but failed to continue downward, and then later rises above the previous low, the trend is likely to reverse.
The 2B principle is actually derived from the concept of resistance and support transforming into each other, still using the previous trend of an uptrend as an example:
When an upward trend reaches its end, it often first forms a minor high before beginning to pull back. After consolidating through the pullback, it accumulates energy again to attack and create a new high. Conversely, if the price creates a new high and then falls back below the previously mentioned minor high, it indicates that the upward trend cannot be sustained.
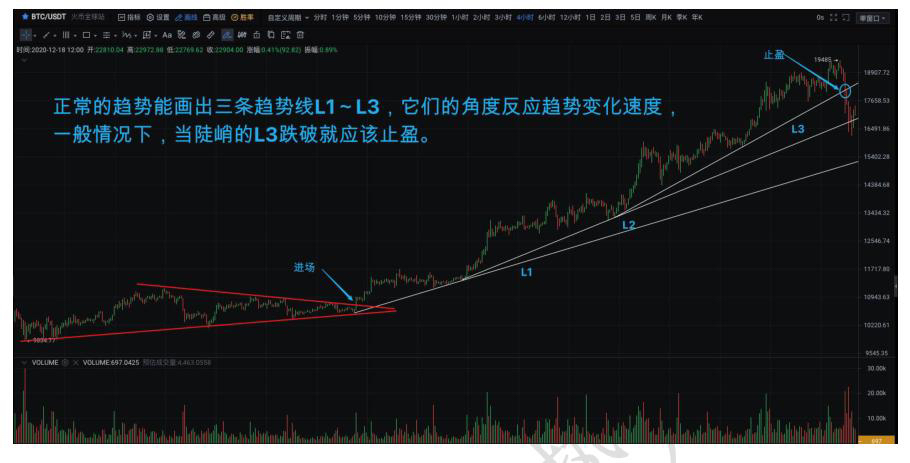
6.8 Take profit at peak
After a period of upward movement, the market will break below the main trendline and enter a consolidation phase. After the consolidation, it may continue to rise.
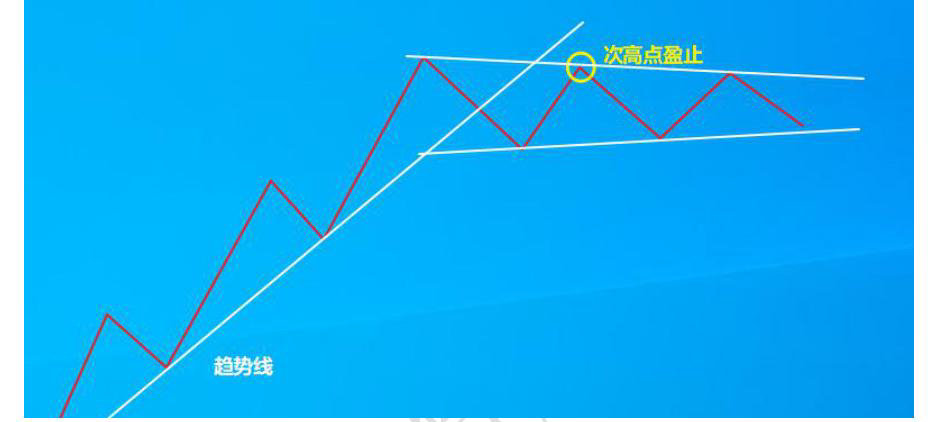
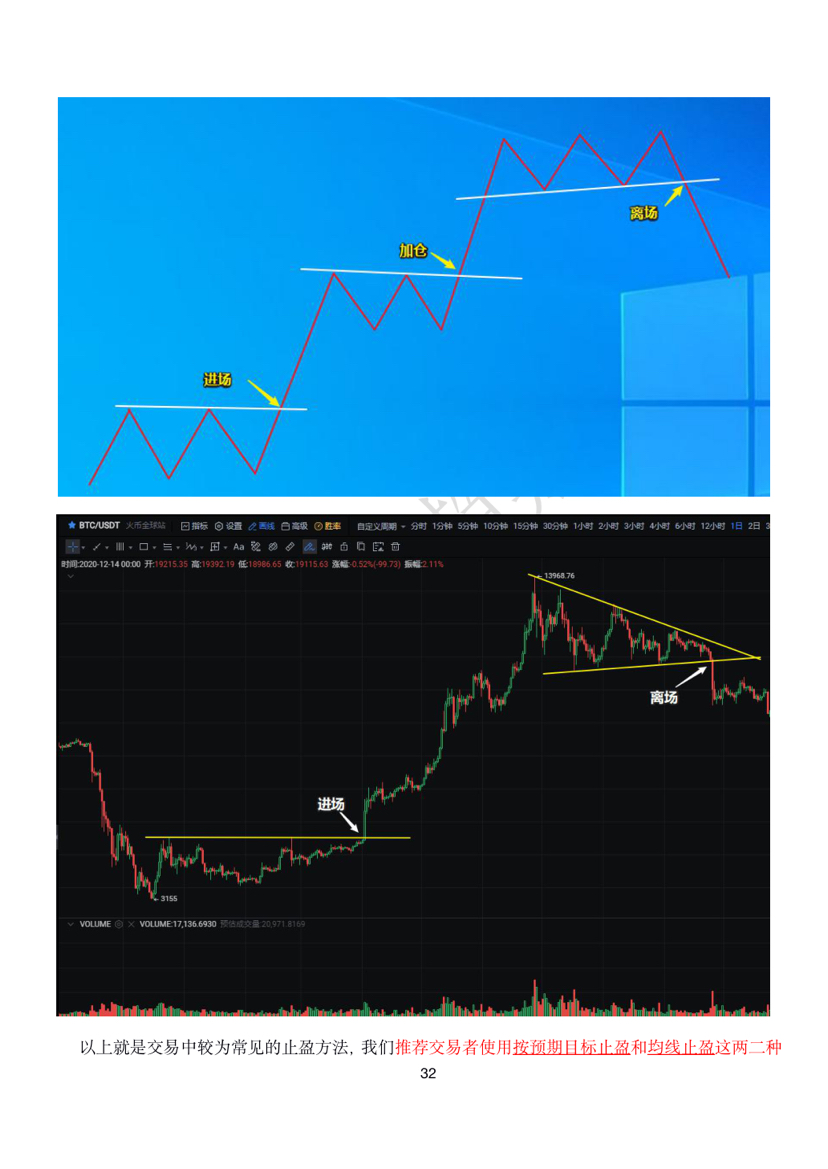
6.9 Trendline take profit
Trendlines are another important tool for tracking market trends and have a very important role. When a strong trend is underway, it often moves steadily along a specific trendline. Each time it approaches the trendline, it continues to advance in the original direction. When the trendline is broken, it indicates that the movement is hindered, and it's time to take profits, as shown in the figure below:
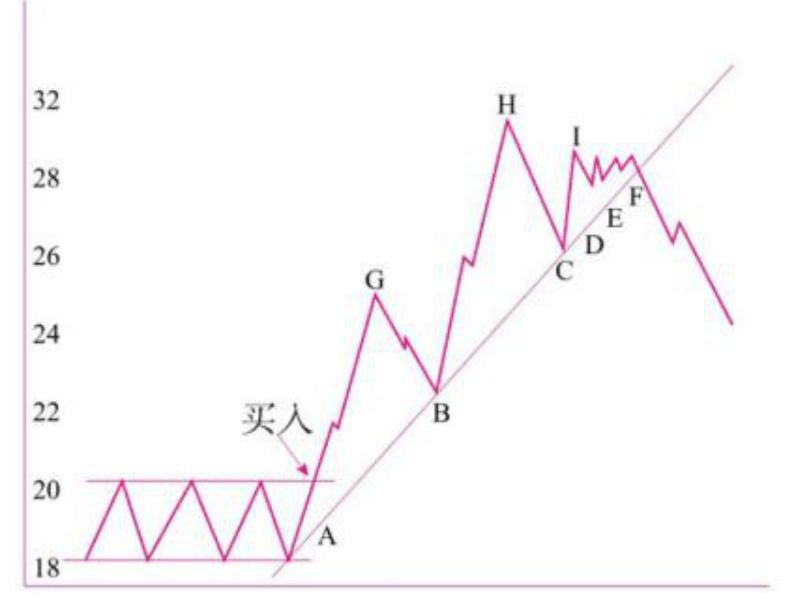
The extension line of points A and B can confirm an upward trendline. The more touchpoints the trendline has, the more effective it proves to be. When the trendline is broken, it is time to take profits at point F.
The actual chart is shown below:
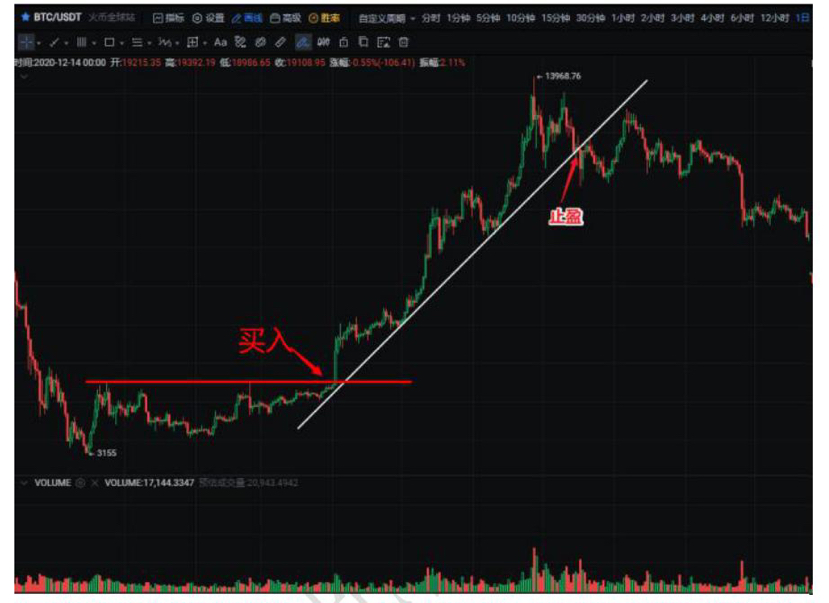
Breaking the trendline will trigger adjustments or even movements in the opposite direction, as shown in the figure below:
6.10 Moving take profit
According to the definition of an upward trend: each low is higher than the previous low, and each high is higher than the previous high; the definition of a downward trend: each low is lower than the previous low, and each high is lower than the previous high. This creates a technique called moving take profit. Let's take a look at the chart below.
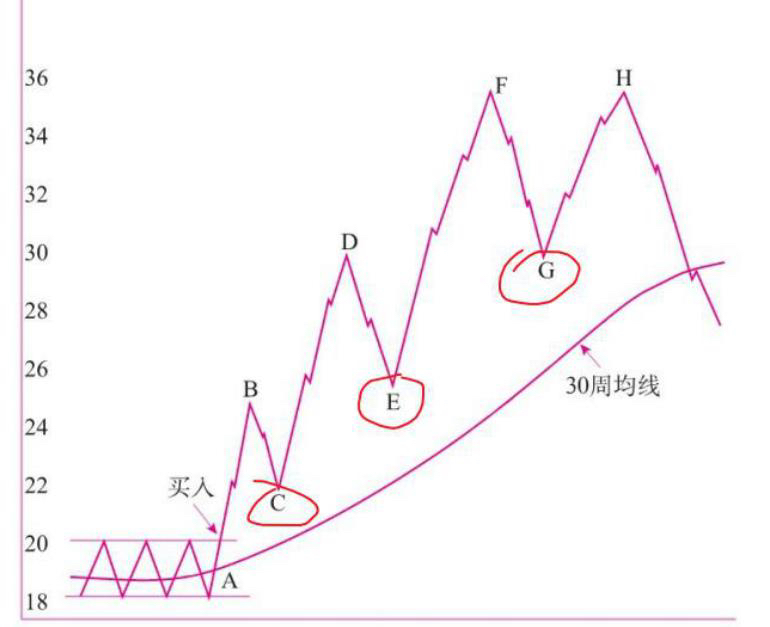
The C, E, and G in the figure represent the moving take profit positions during the market's development. When the market drops below the recent previous low of the pullback, it indicates that the market may be about to reverse, and you should take profits.
Moving take profit can also be referred to as moving stop loss. For trend-following trading systems, it is one of the key holding techniques that allows traders not to prematurely end profits and significantly benefits both locking in profits and letting profits run. The following example is the 30-minute Bitcoin chart: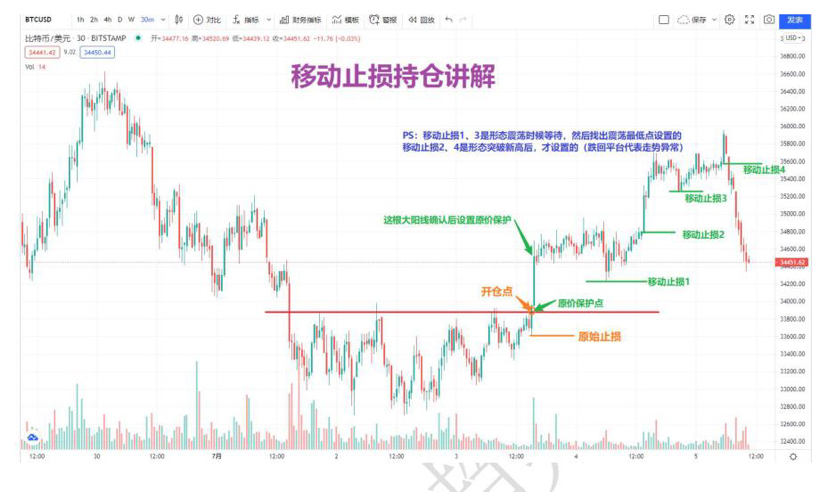
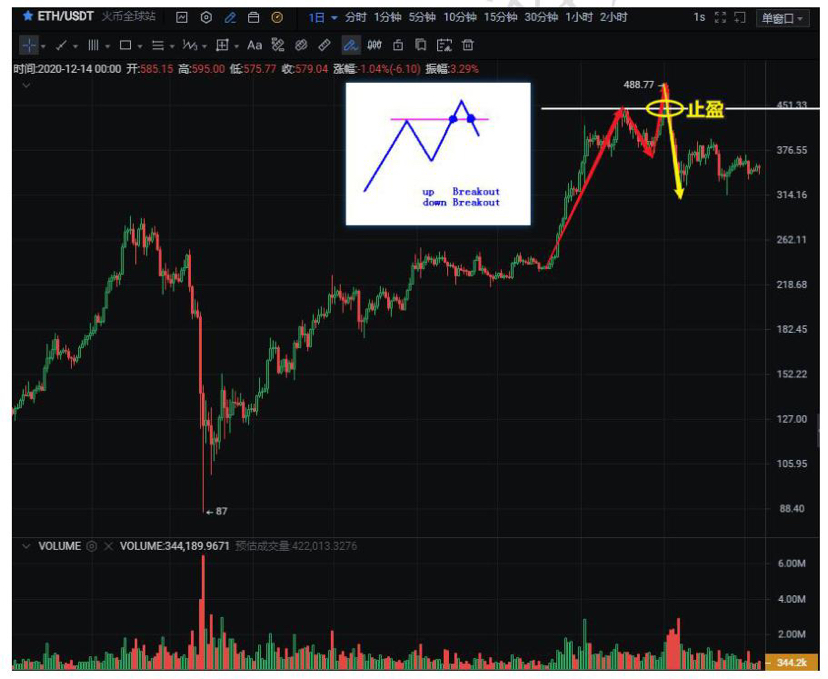
6.11 Pattern breakdown take profit
This is a non-negotiable take profit method. Generally, after the market structure completes a top selling pattern and breaks below the neckline, this is a non-negotiable last chance to escape. At this time, there is no reason not to liquidate all holdings.
Take profit methods, I hope everyone can continuously understand them in practice. Remember, there is no 100% perfect take profit method. If the market continues to rise after taking profits, we should not feel regretful about it.


