When analyzing the evolution of the crypto ecosystem, it’s crucial to observe how value is distributed across the sector. This analysis not only shows us trends but also helps us identify opportunities and risks with objectivity, applying the discipline we value so much in our kaizen approach to continuous improvement.
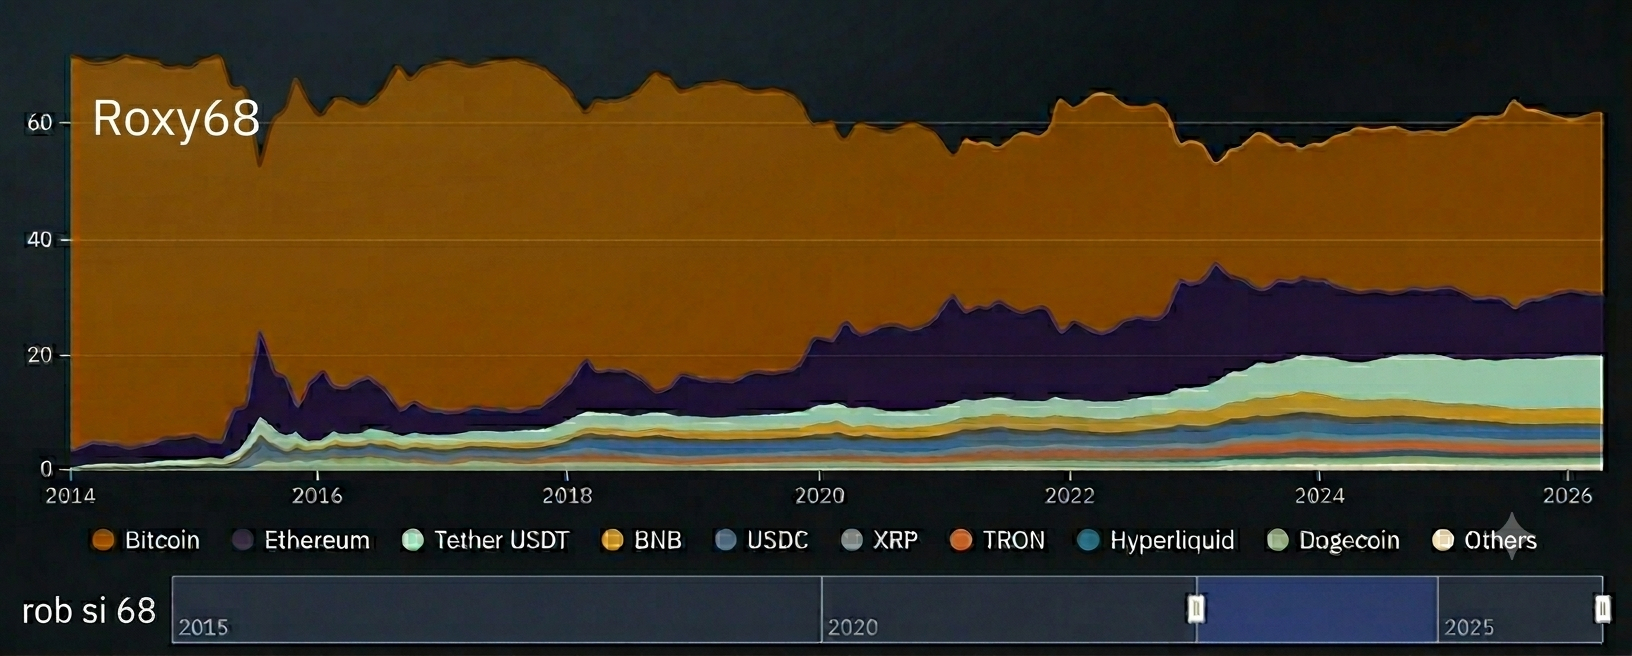
Current Chart Analysis (2014-2026)
By looking at the chart, we can extract key insights for our trading strategy:
Bitcoin is Still the Unquestionable Leader: The percentage breakdown chart confirms that Bitcoin $BTC maintains its dominant position over the rest of the market. Its market cap continues to attract most of the attention from investors, serving as a store of value and a general barometer of the ecosystem.
Evolution of Altcoins: It’s fascinating to notice the historical evolution in the chart. While Ethereum $ETH remains firmly established as the second force, we can see how other altcoins have gained relevance over the years. Coins like BNB, Solana $SOL and Tether $USDT occupy visible portions, demonstrating increasing diversification, although BTC’s hegemony persists.
Importance of Stablecoins and Liquidity: The presence of USDT and USDC is crucial. It tells us how much liquidity is "parked" within the crypto market—ready to enter assets at strategic moments, or serving as a safe haven during volatility.
Applied to Investing: Your Long-Term Strategy
As resilient, long-term-focused investors, this chart teaches us the importance of patience and analysis:
Identify Macro Trends: Don’t get carried away by daily FOMO or panic. Look at the bigger picture shown by years of data.
Smart Diversification: The chart shows that the ecosystem is more than just BTC, but it also reminds us that BTC is the cornerstone. A kaizen portfolio should take this distribution into account.
Keep Learning: Each cycle leaves us lessons. The growth of stablecoins and the emergence of new networks are data points we should study.
Understanding this dominance breakdown is vital for any investor. It’s not about guessing the future, but about preparing for it with verifiable data.
This chart is a data-driven analysis of the market.
This content is strictly educational and informational. It does not constitute financial, legal, or investment advice. Each investor is responsible for their own decisions. Please do your own research before trading in the market.
#Bitcoin #Kaizen #AnálisisDeMercado