♨️Smart Money® Intelligent Position🔆 is a term widely used by price action traders, designed to help them grasp liquidity more accurately and find better trading points in the market. Attempting to determine the order positions of institutional market participants (buy-side or sell-side liquidity) is a very reasonable method for finding more practical entry and exit points based on price action.
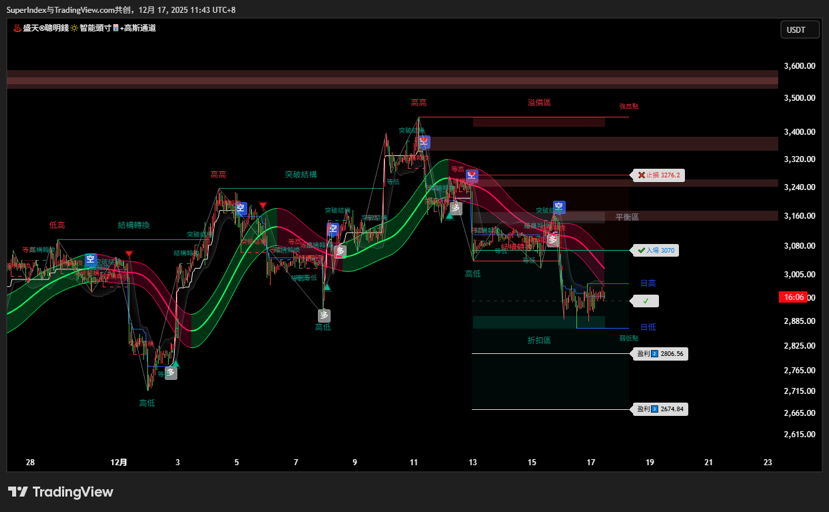
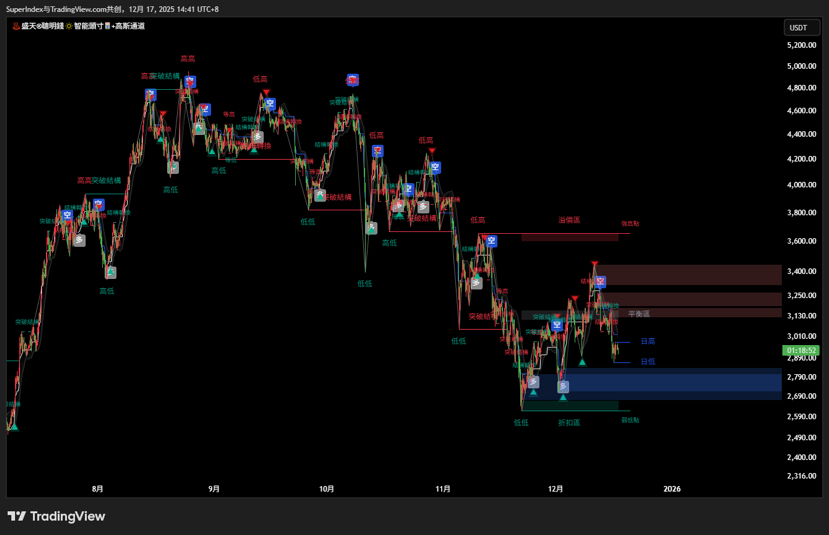
📌This integrated indicator displays market structure (internal and swing structure), order blocks, premium and discount areas, equal highs and equal lows, Gaussian channels, filters, trend baselines, entry points, take profit and stop loss points in real-time, etc.… enabling traders to automatically mark charts using widely applied price action methods.
💘After we released the "♨️Smart Money Community Super Trend" indicator script, we received many requests from the community to release more similar features. ♨️Smart Money® Intelligent Position🔆 + Gaussian Channel This indicator includes all swing structures and many other related conditions, with alerts added to the Gaussian Channel, and smart positions below.
🧿Function:
This indicator includes many features related to SMC, with the following highlights:
🔵Real-time Complete Annotation of Internal and Volatile Market Structure
🟣Structure Break (BOS)
🟡Structure Change (CHOCH)
🟠Order Blocks (Bullish and Bearish)
🟢Peaks and Valleys Equilibrium
🔵Fair Value Gap Detection
🔴Previous Highs and Lows
🟠Advanced and Discount Zones as a Series
🔵Provides options for setting indicator styles for easier display of these concepts.
🟢Gaussian Road (Fast Mode, Filter Mode)
🟡Smart Position (suitable for short-term swing entry take profit and stop loss prompts)
💥About Indicator Settings
Mode: Allows users to choose between historical mode (default) or current mode, where the current mode only displays the most recent data on the chart.
🟢Internal Structure: Displays internal structure labels and dashed lines to indicate them. (BOS and CHoCH).
🔴Confluence Filter: Filters out insignificant internal structure branches.
🟠Swing Structure: Displays swing structure labels and solid lines (larger BOS and CHoCH labels) on the chart.
🟡Swing Point: Displays swing point labels on the chart, such as: " Higher High HH, Higher Low HL, Lower High LH, Lower Low LL".
🟣Internal Order Block: Enables internal order blocks and allows users to select how many recent internal order blocks to display on the chart.
🔵Swing Order Block: Enables swing order blocks and allows users to select how many recent swing order blocks to display on the chart.
🟢Equal Highs and Equal Lows: Displays "Equal High/Low" labels on the chart for detecting equal highs and equal lows.
🟠Bar Line Confirmation: Allows users to select how many bars are needed to confirm equal high and equal low symbols on the chart.
🟣Fair Value Gap: Displays a box on the chart to highlight imbalanced areas.
🔴Automatic Threshold: Filters out insignificant fair value gaps.
🟢Time Range: Allows users to select the time range for fair value gap detection.
🟡Extended Fair Value Gap: Allows users to select the number of bars to extend the fair value gap box on the chart.
🟠High-Low Points MTF: Allows users to display historical highs and lows within daily, weekly, and monthly timeframes as significant levels.
🔵Premium/Discount Areas: Allows users to display premium zones, discount zones, and equilibrium zones on the chart.
1️⃣. Market Structure System
This is the core of the indicator. You will see two main annotations:
Structure Change (CHoCH): Marked with a dashed line, occurs when the recent swing high or low is broken. This is an early warning signal for potential trend reversal.
Structure Break (BOS): Marked with a solid line, occurs when the second swing point is broken. This confirms and reinforces the existing trend.
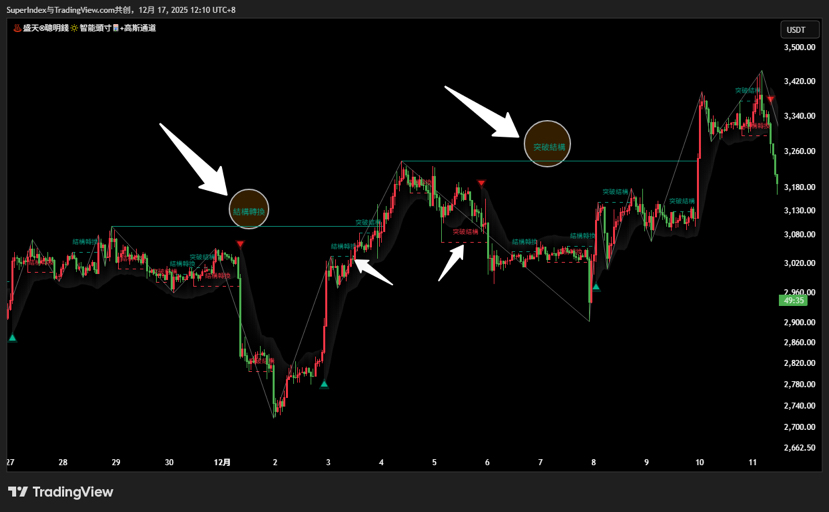
Note the different thickness of the lines:
Dashed Line: Internal Structure — small structures within larger price fluctuations.
Solid Line: Swing Structure — Key signals from higher timeframes
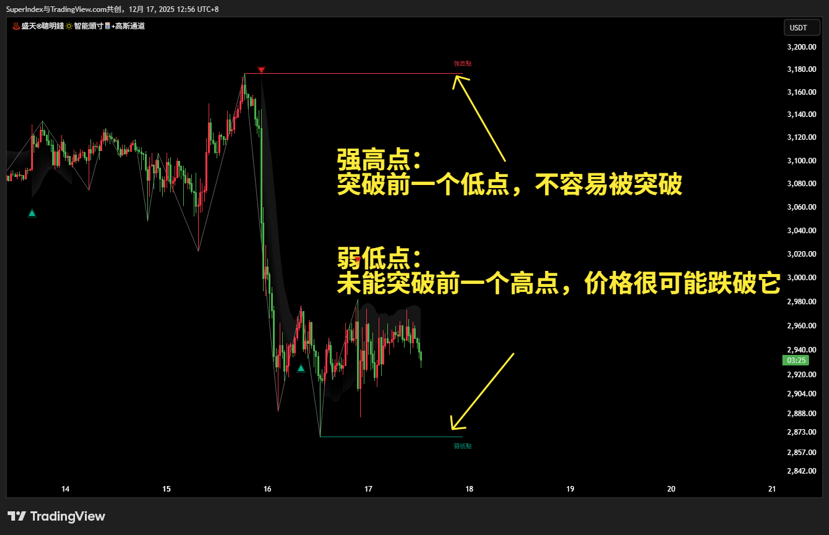
2️⃣. "Strength and Weakness" Analysis
This is one of my favorite features. The indicator automatically identifies:
Strong High: Broke the previous low, should be protected, not easily broken.
Weak Low: Failed to break the previous high, becoming a target — price may drop through it.
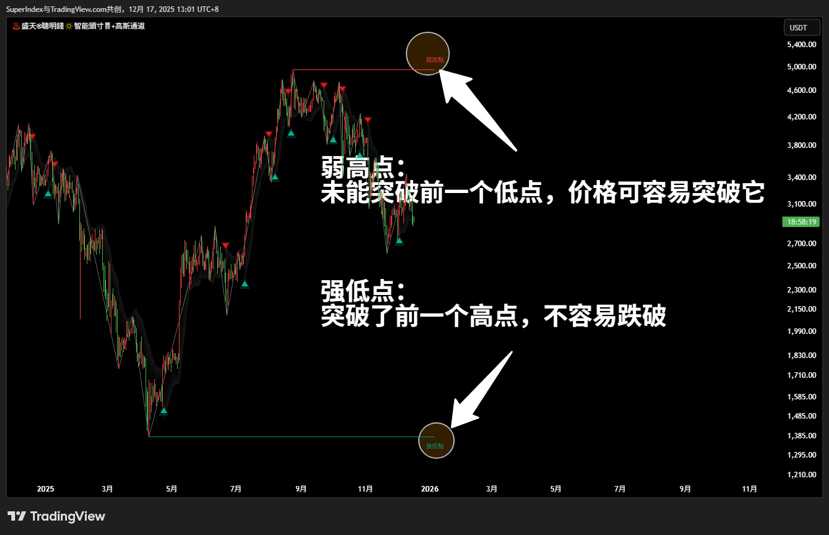 Strong Low: Broke the previous high, should be protected, not easily broken.
Weak High: Failed to break the previous low, becoming a target — price may break through it.
These points are marked with trend lines extending to the right, allowing you to see key decision points at a glance.
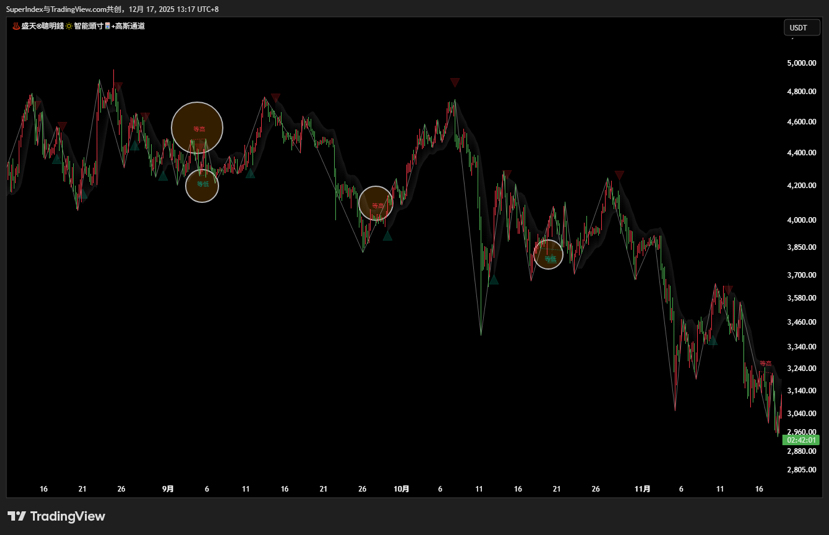
3️⃣. Order Block System
Order blocks are precise areas of support and resistance, providing excellent entry opportunities. We have two types: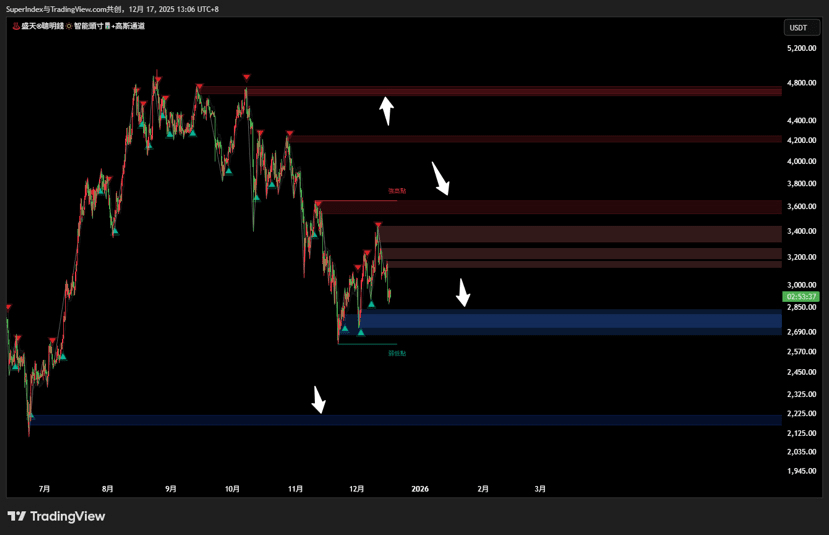
Internal Order Block: Smaller structures inside
Swing Order Block: More important, within higher timeframes.
When the price returns to these order block areas, it usually creates a strong reaction.
4️⃣. Fair Value Gap (FVG)
These are the imbalanced areas on the chart formed by three candlesticks:
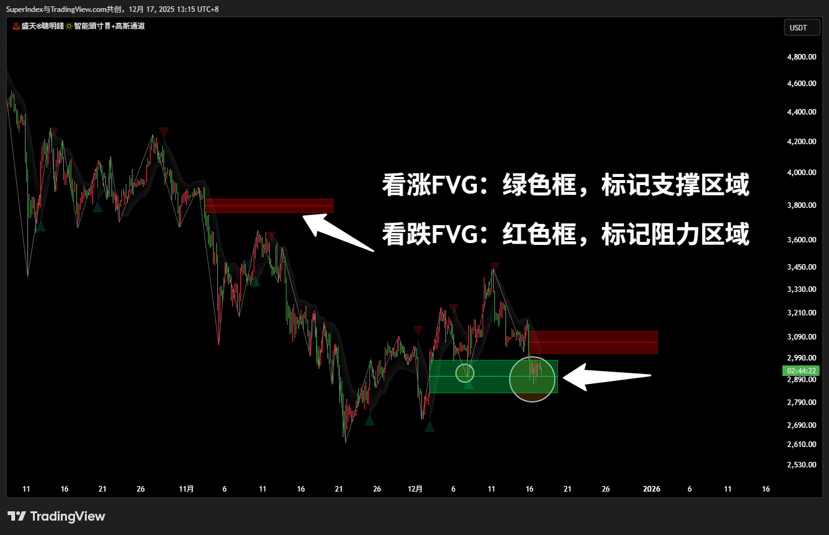
Bullish FVG: Green box, marking support area
Bearish FVG: Red box, marking resistance area
These areas act like magnets for price — the market has a strong tendency to fill these gaps. You can treat them as precise entry points.
5️⃣. Equal High/Low Recognition
When the market forms a double top or bottom at similar price levels, the indicator automatically marks "equal high" or "equal low".
 These are liquidity accumulation areas — a large number of stop-loss orders are placed above or below them. When the price approaches these areas, it is often "pulled" towards them, creating excellent breakout or reversal trading opportunities.
6️⃣. Multi-Timeframe Levels (MTF)
You can view key highs and lows on daily, weekly, and monthly charts simultaneously.
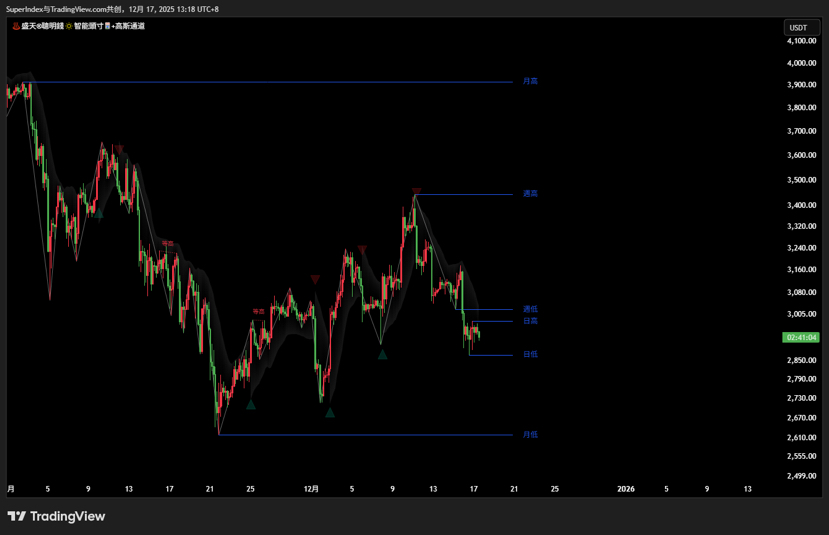 Golden Rule: The larger the timeframe, the more reliable the level, and the less likely it is to be manipulated. When levels from multiple timeframes converge, it forms a strong confluence area.
7️⃣. Premium/Discount/Equilibrium Zone
The indicator divides the current price range into three areas:
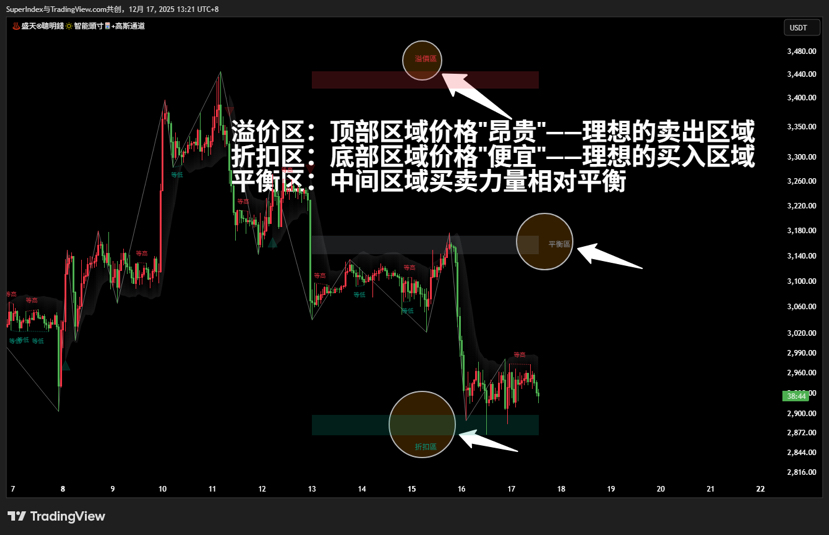 Premium Zone: Top area, considered "expensive" — ideal selling area
Discount Zone: Bottom area, considered "cheap" — ideal buying area
Equilibrium Zone: Middle area, where buying and selling powers are relatively balanced.
Want higher probability trades? Sell at premium, buy at discount.
🎯 Unique Trading System
8️⃣. Smart Take Profit and Stop Loss System
This is one of the most powerful features of the indicator. It is not just an analysis tool but a complete trading system.
When a trading signal occurs, the indicator automatically draws:
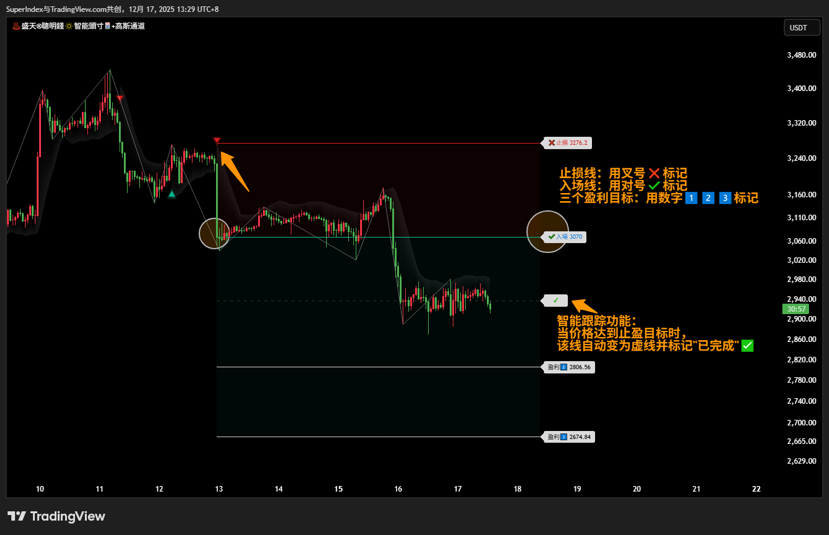
Stop Loss Line: Marked with a cross ❌
Entry Line: Marked with a check ✔️
Three Profit Targets: Marked with the numbers 1️⃣2️⃣3️⃣
Smart Tracking Function: When the price reaches a certain target, the line automatically turns into a dashed line and is marked "Completed" ✅
Calculation logic based on ATR (Average True Range):
Target 1: Entry Price ± ATR × (5 + User Set Value)
Target 2: Entry Price ± ATR × (10 + User Set Value × 2)
Target 3: Entry Price ± ATR × (15 + User Set Value × 3)
9️⃣. Range Filter
This is an adaptive moving average system used to filter market noise and confirm trend direction.
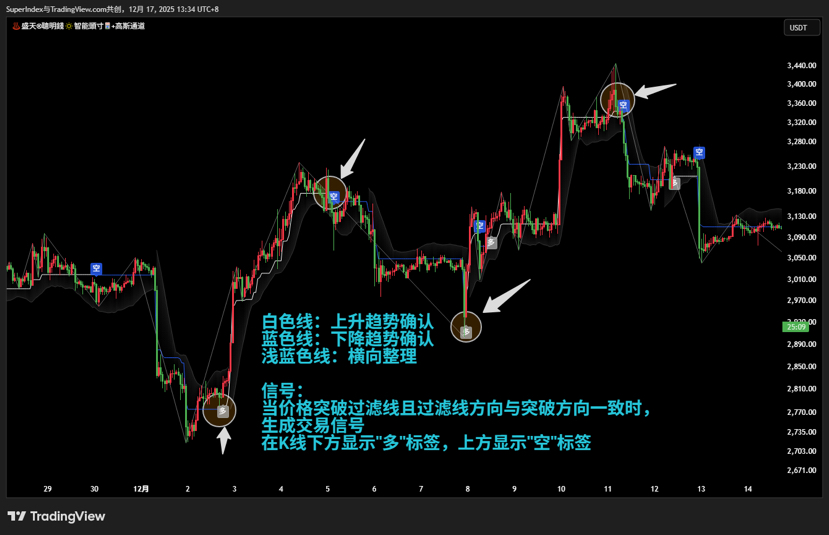
White Line: Uptrend Confirmation
Blue Line: Downtrend Confirmation
Light Blue Line: Horizontal Consolidation
Signal Generation Logic:
When the price breaks the filter line and the filter line direction aligns with the breakout direction, a trading signal is generated.
Displays "Long" label below the candlestick and "Short" label above
This filter significantly reduces false signals, only reminding you when you should take action.
🔟. Gaussian Channel
This is not an ordinary Gaussian channel; the Gaussian channel is not a traditional moving average channel but a smart trend tracking system built on Gaussian filters and adaptive ranges.
https://www.tradingview.com/x/Ed90SjgL/ In this indicator, it is used as a short-term range filter, the core function is to identify the true market trend direction and filter out noise.
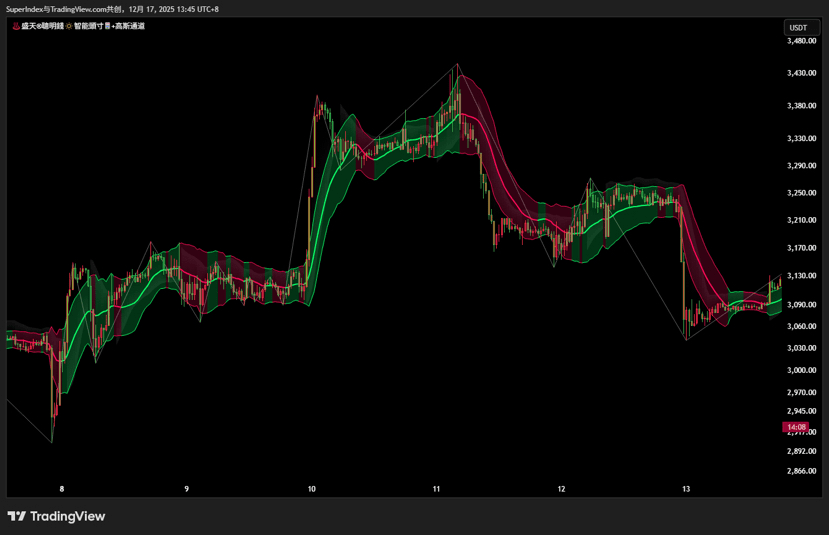
A Reduced Lag Mode
B Fast Response Mode
Remember: In the full system of the Smart Money concept, the Gaussian Channel acts like a "quality inspector", ensuring you only participate in the highest quality, most confirmed trading setups. It helps you avoid entering too early and chasing false breakouts, significantly increasing the success rate and risk-reward ratio of trades.
 ♨️Smart Money® Intelligent Position🔆 + Gaussian Channel System. It will be the holy grail on your trading journey. Why is that? Because it will automatically do all the hard drawing work for you — identify market structure, fair value gaps, order blocks… and more… all you need to do is focus on the most important decision: understanding all the information this system provides and pressing the buy or sell button.#美国非农数据超预期 #交易指标 #趋势分析 #交易员 $BTC $ETH $XRP
