
At first glance, the Matching Low resembles the Tweezer Bottom, but it is a stricter and rarer version. It is not just about wicks touching, it is a firm declaration by buyers at a specific price level.
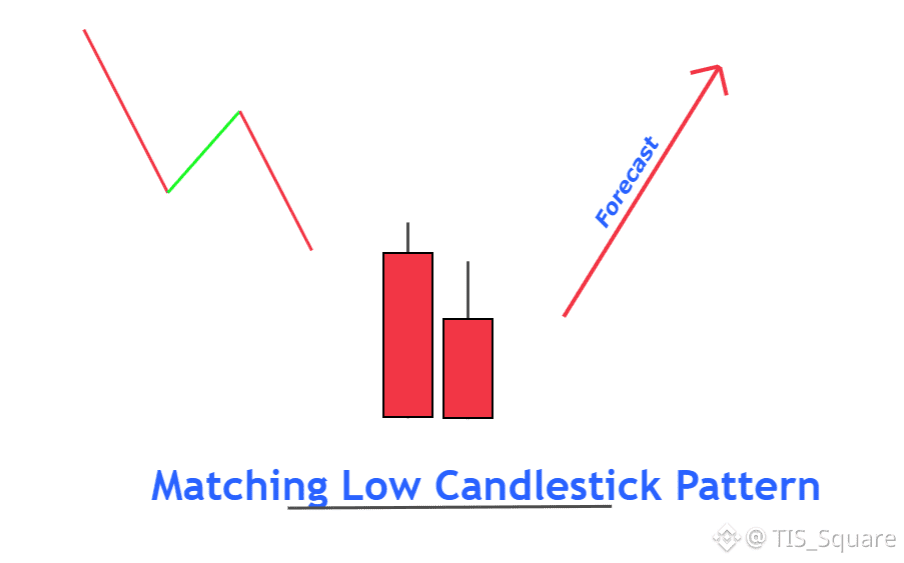
🔹 The Distinct Twins Structure This pattern consists of 2 red candles within a downtrend
Candle 1, a long bearish candle, showing strong selling momentum.
Candle 2, another bearish candle, but here is the anomaly: Its Closing Price is equal to the Closing Price of Candle 1.
🔸 Why did the second candle stop exactly at that price?
In a strong downtrend, the fact that Bears could not push the close lower than the previous day indicates they have hit a submerged rock.
This signals Hidden Limit Orders. Bulls are silently absorbing all selling pressure at this specific level, creating a solid concrete floor.
🔹 Low is often a signal for a short term bottom or a springboard for a rebound.
Since both are still red candles, selling pressure remains.
You must wait for a Green Confirmation Candle on the third session to ensure the Bears have truly retreated.
When price stop twice at the exact same figure, do you believe in market randomness, or do you believe in the supporting hand of the Whale?
This article is for reference only, this is not investment advice. Please read and consider carefully before making a decision.