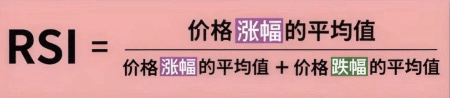
The RSI value reflects the strength of the upward trend relative to the downward trend in the short term. In other words, the larger the RSI value, the stronger the upward trend relative to the downward trend; the smaller the RSI value, the weaker the upward trend relative to the downward trend.
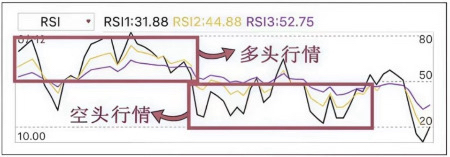
1. RSI Bullish and Bearish Signals
RSI > 50 is considered a bullish market; RSI < 50 is considered a bearish market.
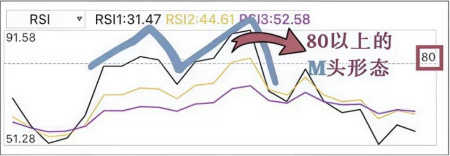
2. RSI Reversal Signals
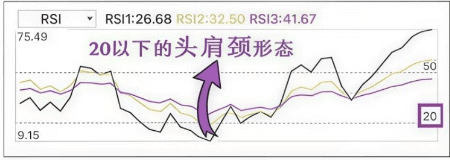
RSI > 80 indicates overbought conditions and may reverse downward; RSI < 20 indicates oversold conditions and may reverse upward.
1. When the RSI forms an M top or head and shoulders top pattern above 80, it is considered a downward reversal signal, and selling is recommended, as shown in the figure below:
2. When the RSI forms a W bottom or head and shoulders bottom pattern below 20, it is considered an upward reversal signal, and buying is recommended, as shown in the figure below:
Three, RSI golden cross and death cross
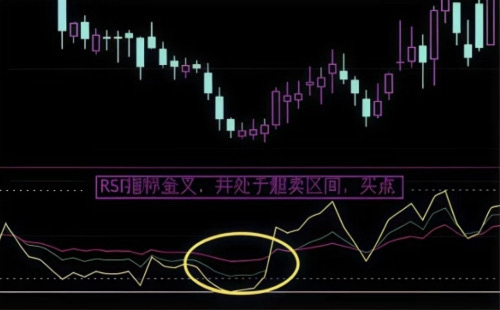
1. When the RSI fast line breaks upward through the slow line to form a golden cross, the price will begin an upward mode.
The golden cross in the oversold area below 20 indicates a strong possibility of a surge. When the golden cross occurs in the strong zone above the middle axis line of 50, the price has limited room for increase and a probability of decline.
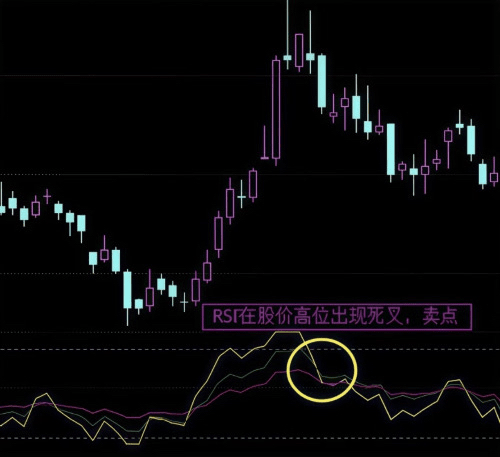
2. When the RSI fast line breaks down through the slow line to form a death cross, the price will enter a downtrend.
The death cross in the overbought area above 80 indicates that a decline is imminent. The death cross in the weak zone below the middle axis line of 50 will not lead to a sharp decline.
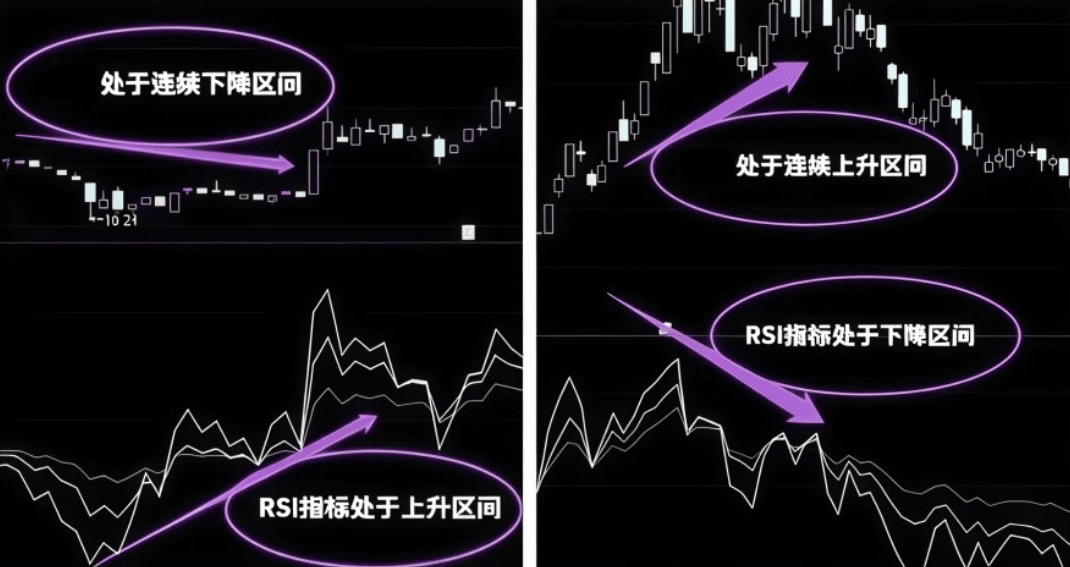
Four, RSI bottom divergence and top divergence
1. Bottom divergence
When the price on the candlestick chart repeatedly makes new lows, but the RSI creates a recent new low and then forms a progressively higher trend, this is bottom divergence. The phenomenon of bottom divergence is generally a signal that the price is about to reverse at a low position, and buying can be considered.
2. Top divergence
When the price on the candlestick chart repeatedly makes new highs, but the RSI creates a recent new high and then forms a progressively lower trend, this is top divergence. Top divergence is a signal that a reversal is about to occur at a high position, and selling can be considered.