
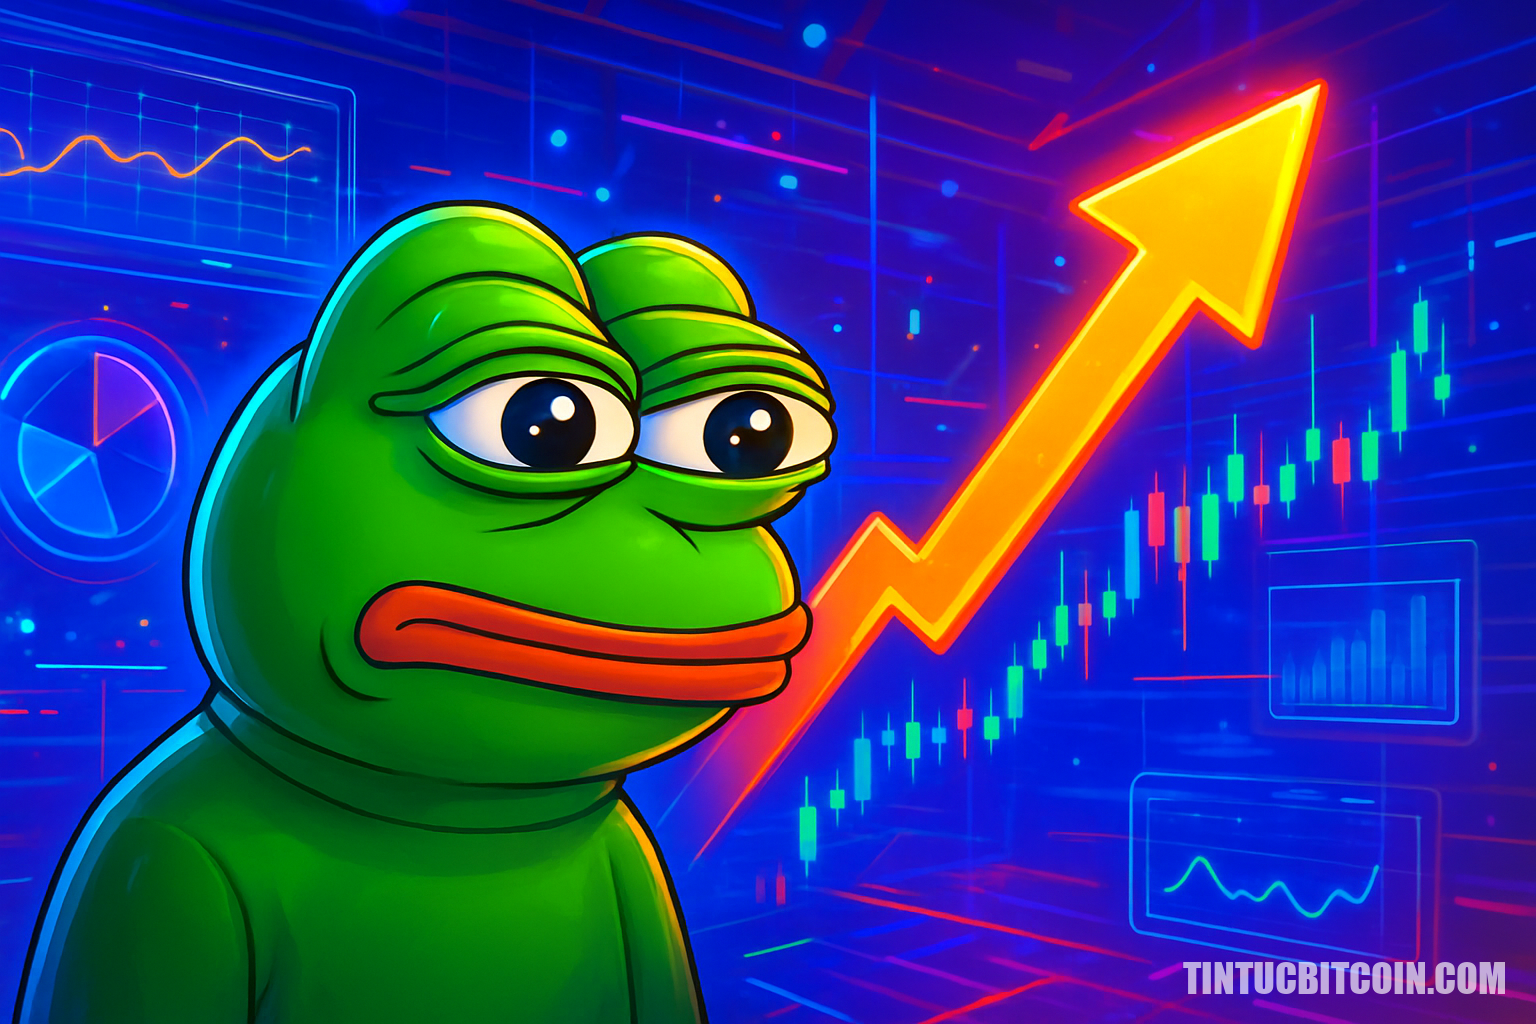
PEPE is at a 'breakout or breakdown' threshold as prices are compressed within a descending wedge pattern, while spot buying absorbs selling and increased leverage may cause the next structural break to occur quickly and powerfully.
After a long 10x leverage trade was recorded by Onchain Lens, PEPE returned to the sights of speculators. However, the overall position data remains quite balanced, indicating that the market is 'testing' the breakout point rather than betting unidirectionally with high confidence.
MAIN CONTENT
PEPE is compressed in a descending wedge, holding above the support zone of 0.0000039–0.0000037; breaking will determine the trend.
Spot buying (taker) is absorbing selling pressure, creating a price base despite low volatility.
Open Interest increased by about 7.6% to nearly $222 million; the long/short positions are nearly balanced, increasing the risk of volatility explosion.
The descending wedge constricts PEPE's price just above the support zone.
PEPE is accumulating in a descending wedge pattern, as buyers continuously defend the 0.0000039–0.0000037 zone while sellers limit recovery under resistance around 0.0000050.
The price of PEPE continues to contract within a clear descending wedge, with prices holding just above the support zone of 0.0000039–0.0000037. Sellers consistently create lower highs below the wedge's resistance line, currently converging near 0.0000050, causing all upward attempts to be thwarted.
On the contrary, buyers repeatedly defend the same bottom, preventing prices from decisively breaking below the support zone. This development leans more towards 'absorption' rather than 'capitulation' as selling pressure fails to create a continuation.
If it clearly breaks below 0.0000037, the next mentioned downside zone is 0.0000030, where there was previously historical liquidity. If it breaks the resistance of the wedge, the target path opens up towards 0.0000063 and then 0.0000079, areas that have previously shown price reactions.
The spot buyers are quietly absorbing selling pressure.
The spot taker CVD remains positive, indicating that buyers are absorbing market sell orders, contributing to keeping prices sideways rather than dropping sharply, although the supply above still restrains recovery.
The spot taker CVD remains positive, confirming that buyers continue to 'eat' market sell orders even though prices have not broken out. Each drop attracts active taker buying, limiting the chances of a rapid price decline.
However, the supply hanging above is still blocking recovery attempts, delaying the expansion process towards the upside. The divergence between active buying and sideways prices often reflects accumulation more than distribution, as sellers fail to pressure the market into creating lower lows.
This steady absorption helps form a price base under the market. As leverage increases, the spot buying plays a 'stabilizing anchor' role, increasing the likelihood that a structural break (if it occurs) will lead to a volatility expansion phase rather than continued compression.
Open Interest increases as leverage continues to be pumped in.
Open Interest increased by about 7.6% to nearly $222 million, indicating that new leverage is entering the market while prices are compressed, increasing liquidation sensitivity.
Open Interest increased by about 7.6% to around $222 million, reflecting that traders are opening new positions instead of reducing risk. In the context of prices remaining compressed, an increase in OI often makes the market more sensitive to liquidation sweeps.
When Open Interest increases but the trend has not expanded, the common scenario is a 'forced' shift due to leverage being concentrated on both sides as prices approach critical structural points. At that point, even moderate volatility can cause crowded position clusters to unwind quickly.
The consequence is a strong reaction speed as soon as the market chooses a direction. Therefore, the growth in Open Interest amplifies the importance of current price levels and raises the stakes for both breakout and breakdown phases.
Do longs really control the PEPE market?
The long/short ratio is nearly balanced (long about 52%, short about 48%), indicating that the upward bias is only slight and confidence is not strong; therefore, a structural break could quickly reverse the position state.
The long/short positioning still slightly favors long, with long at about 52% and short at about 48%. This spread creates an upward bias but is not enough to be called 'overwhelming', indicating that confidence remains fragile.
When no side dominates leverage, the market often lacks 'fuel' for an immediate sustainable trend. Conversely, this balanced state can increase instability: a small movement can quickly flip sentiment and trigger a series of position exits.
Longs will face forced exit risks if prices break below the support zone, while shorts will be under pressure if prices break above the wedge's resistance. Therefore, leverage at this time acts like 'kindling', waiting for a clear directional trigger rather than creating a trend on its own.
The decisive price levels for PEPE's breakout and breakdown.
PEPE stands at an important inflection point: breaking below 0.0000037 could pave the way to 0.0000030, while breaking above 0.0000050 will guide the market up to 0.0000063 and 0.0000079.
A compilation of signals suggests that PEPE is trading at the intersection of three factors: structural compression, persistent spot absorption, and increasing leverage. In such an environment, technical levels often matter more than market sentiment.
Downside scenario: if prices break below 0.0000037, the risk of acceleration towards 0.0000030 increases as this area is referred to as a point of historical liquidity. Upside scenario: if it clearly breaks above 0.0000050, the focus will shift to 0.0000063 and 0.0000079.
With high leverage and fairly balanced positions, the market tends to 'decompress' with a volatility expansion phase rather than continuing to drift sideways. The direction will depend on which side loses control first, causing the next structural break to be decisive.
Conclusion
PEPE is at a critical zone, where prices struggle to maintain a compressed state and tend to 'resolve' with volatility expansion.
PEPE is in a decisive area: prices are likely to 'choose a direction' with a volatility expansion phase.
The next movement may prioritize speed and force, rather than proceeding gradually.
Frequently Asked Questions
What price level is the most important support for PEPE?
The support zone of 0.0000039–0.0000037 is currently important. If prices break below 0.0000037, the next mentioned zone is 0.0000030.
Where is the main resistance of PEPE in the current model?
The resistance of the descending wedge is converging around 0.0000050. Breaking this level could open the way towards 0.0000063 and 0.0000079.
What does the increase in Open Interest to $222 million indicate?
Open Interest increased by about 7.6% to nearly $222 million, indicating that new leverage is entering the market. As prices remain compressed, this increases the risk of strong volatility and liquidation if a structural break occurs.
A long/short ratio of 52%/48% means that the upward trend is definitely established?
No. This ratio only shows a slight upward trend, remaining quite balanced, so confidence is not strong. A near-balanced state can make the market easily 'flip' quickly when prices break support or resistance.
Source: https://tintucbitcoin.com/pepe-siet-bien-cho-pha-vo-quyet-dinh/
Thank you for reading this article!
Please Like, Comment, and Follow TinTucBitcoin to stay updated with the latest news about the cryptocurrency market and not miss any important information!
$BTC $ETH $BNB $XRP $SOL


