
I have shared the complete trading numbers for ACEUSDT in the list above and there are several reasons, you will understand them as we browse this chart.
The first is of course the potential for huge growth. A project trading at low prices with massive growth potential. A chart says the next move is closer than you think. A chart supported by really high trading volume, and that is the second reason.
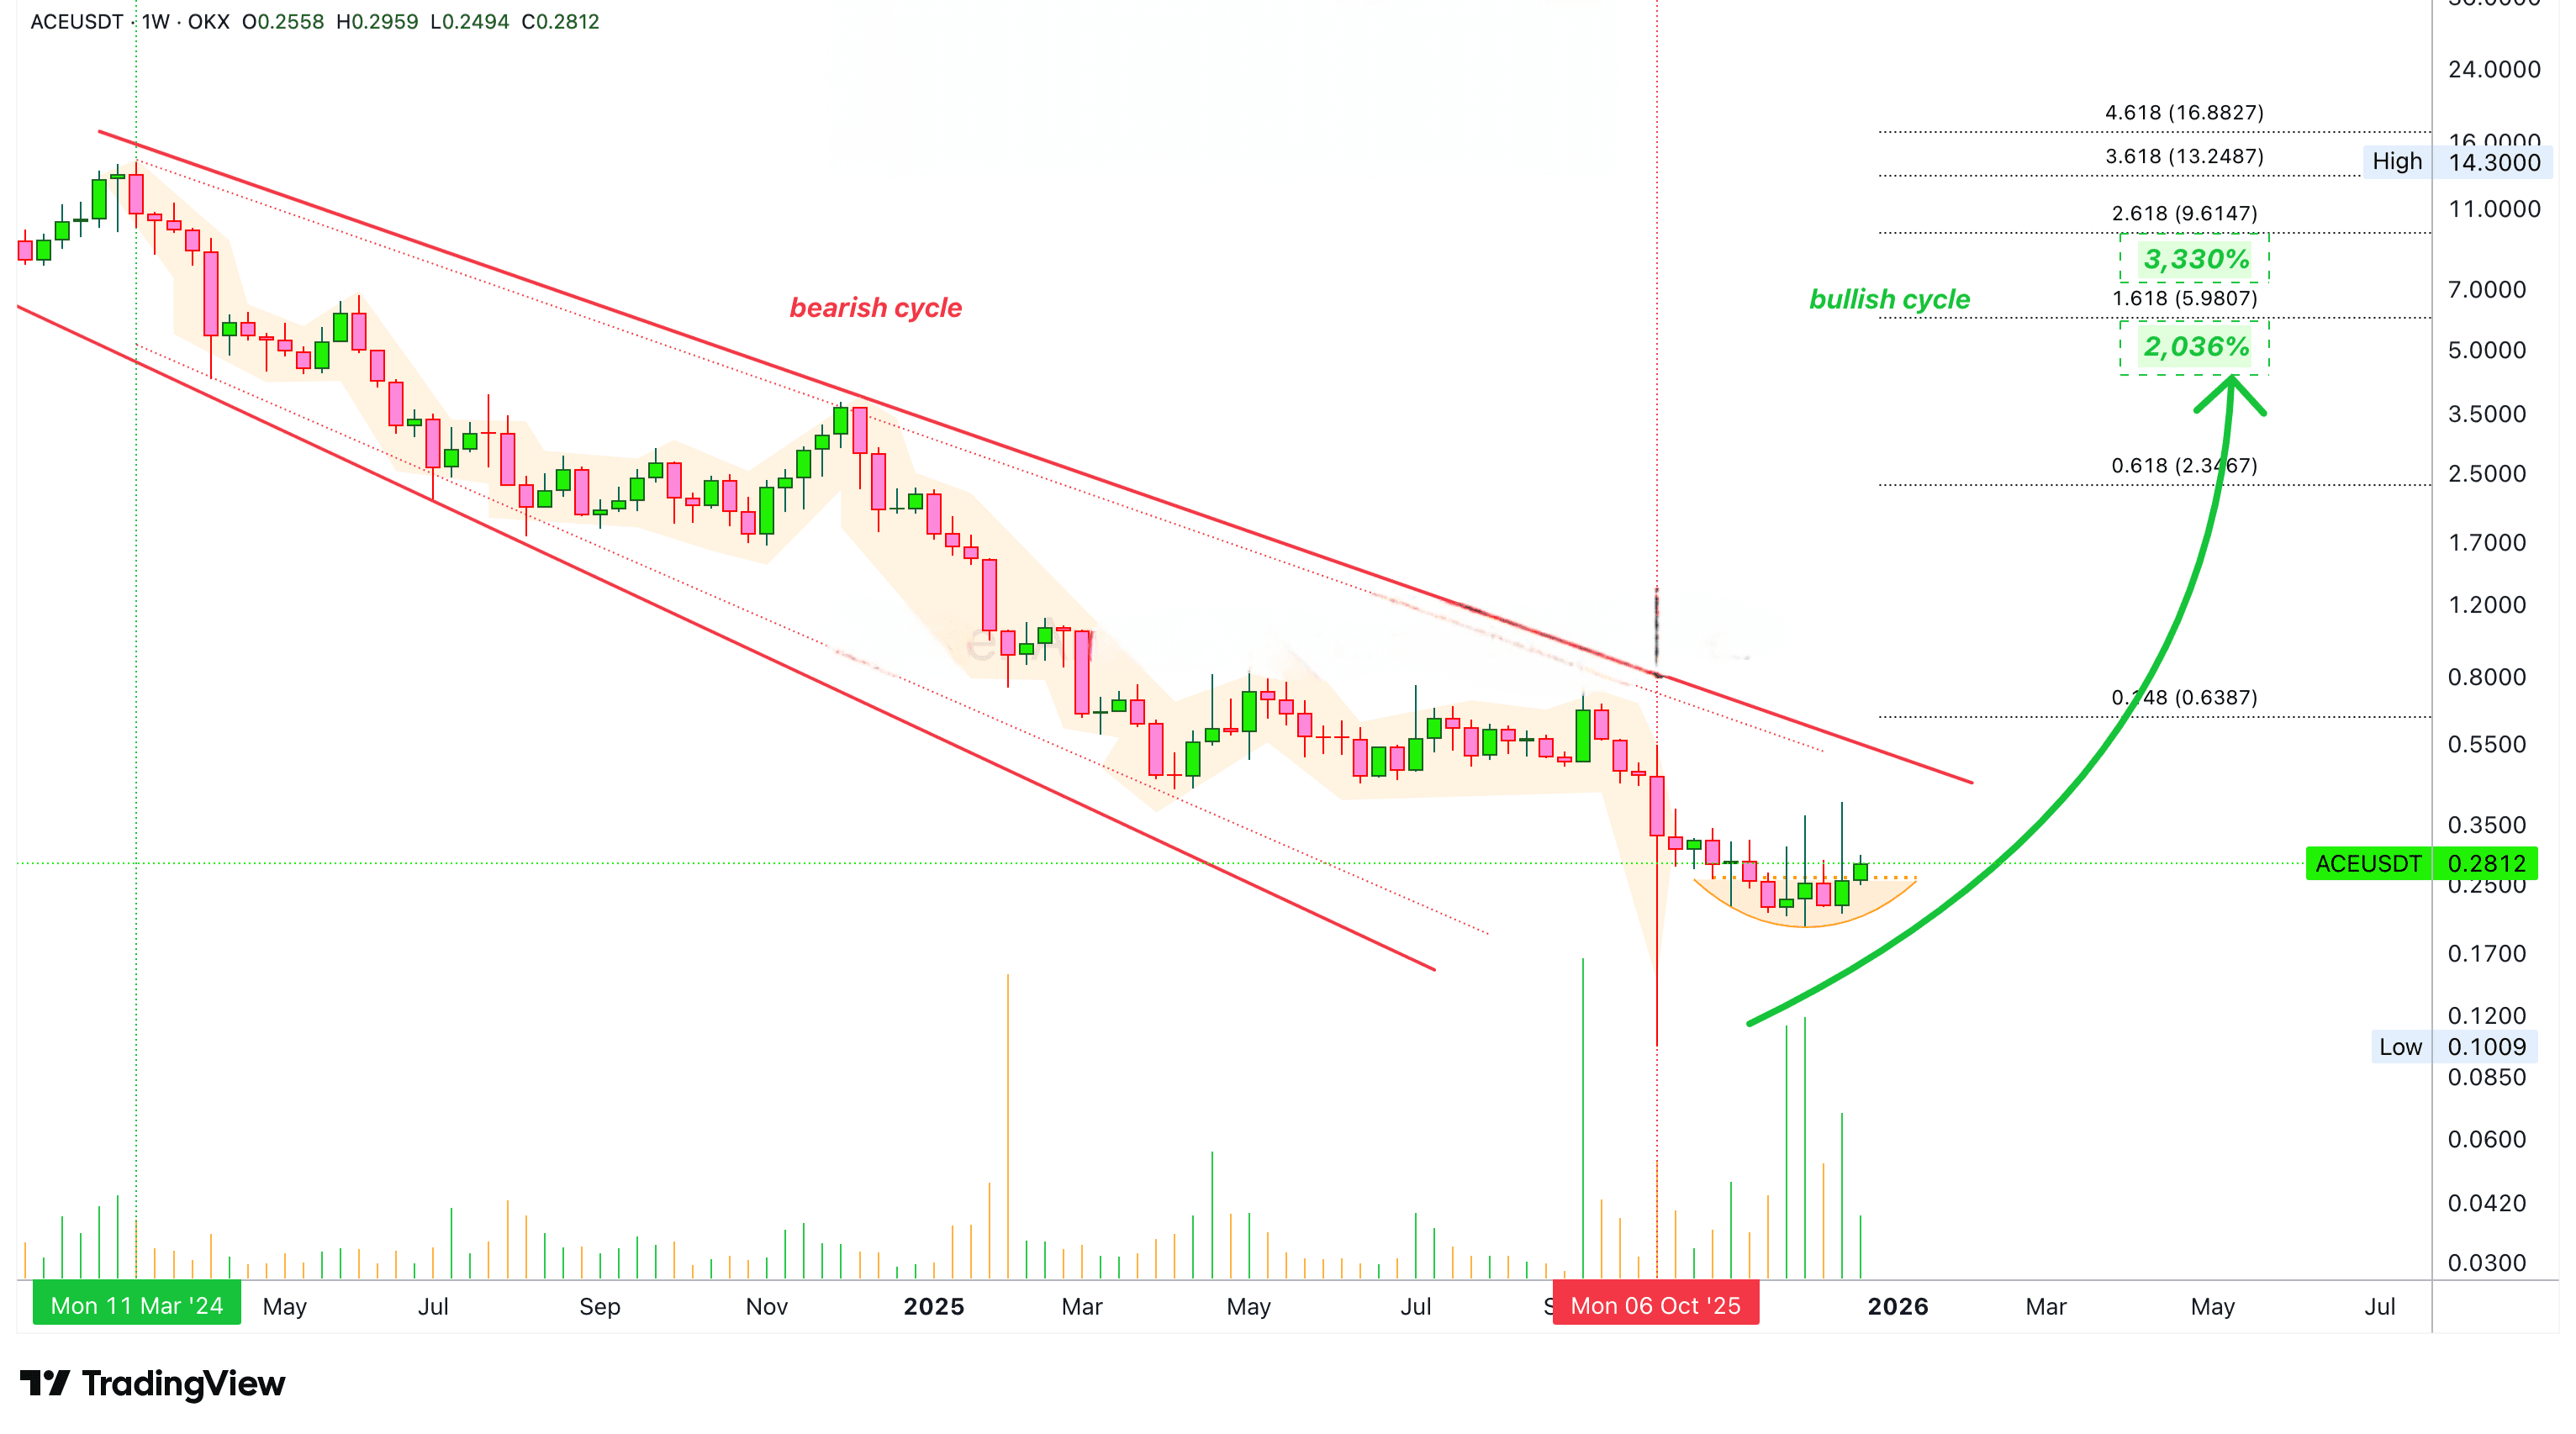
The volume indicator here shows very strong buying activity not just recently but since September 2025. This is highly desirable and also reveals a lot.
Typically, the highest volume for a new project tends to occur on the launch day, the day it opens for trading. Here we can see how ACEUSDT produced its highest volume ever close to its historical low. So even before the project hit the bottom, sellers were eagerly waiting and buying. Then after reaching ATL, it produced two additional weekly sessions with very high volume, higher than the first trading week. There is a lot of interest in this project behind the scenes and that is enough to alert us to strong activity in the coming months.
A highly active project in this market can lead to exceptional growth, perhaps one of the best performers. I say perhaps because there isn't much history and I'm not familiar with the project. But the chart/numbers don't lie.
There is a cup pattern indicating confirmation of a higher low and recovery of the low after a quick rebound. Moving above the neckline of the pattern makes this a bullish development. Overall, we have several bullish signals working together here so I don’t have much left to say.
I could go on, but my goal is not to overwhelm you with a lot of data and information about technical analysis but to show a great opportunity for the days and weeks ahead. A great start to 2026.
I write for your entertainment of course, but at this moment, the focus is on finding charts and projects that are at their lows with huge growth potential. When the market starts to move, we can focus on other topics and share some fun. Now is the time to focus on work.
This is a great chart, huge potential... Thank you very much for your continued support.
The bullish cycle follows a bearish cycle. Just as you can't have consecutive bullish markets, you can't have consecutive bearish markets. Since ACE has already gone through a bear market, we know that the bull market comes next. The chart attached to this post is the evidence.
⚠️ Disclaimer:
This analysis is for educational purposes only and does not encourage trading in futures or any prohibited transactions. The goal is to illustrate potential market movements, not a direct recommendation to buy or sell.
💡 Important notes:
- This analysis is for educational purposes only.
- Please study the market and make decisions based on your ability and risk tolerance.
- The author is not responsible for others' trading or their profit results.
Thank you for reading.
Namaste.
✅ Trading here on $ACE