Hidden in the oscillating and declining candlestick is a key signal that most people overlook. Looking at BNB's 4-hour candlestick, does it feel very tangled? The price is clearly oscillating down around 854.59, unable to go up or down. Many people are caught in a dilemma, staring at the resistance level of 873 and the support level of 826.
But if you observe closely, you will find a strange contradiction. The market is in a trend of oscillating decline, yet the MACD's white and yellow lines are firmly standing above the zero axis!
News:

Looking at the latest dynamics of Yi Li Hua. This big shot openly stated, "Continuously increasing ETH holdings, heavily investing in WLFI and allocating BTC/BCH/BNB." Note the last three letters BNB.
It's not news that the big shots are allocating BNB, but at this point in time, emphasizing the current technical position of BNB is worth pondering. This isn't just a call; it's backed by real money.
But players shouldn't rush to follow; the big shots' "allocation" may be calculated monthly or even annually, while your position may not be able to endure such long fluctuations.
Technical Analysis:
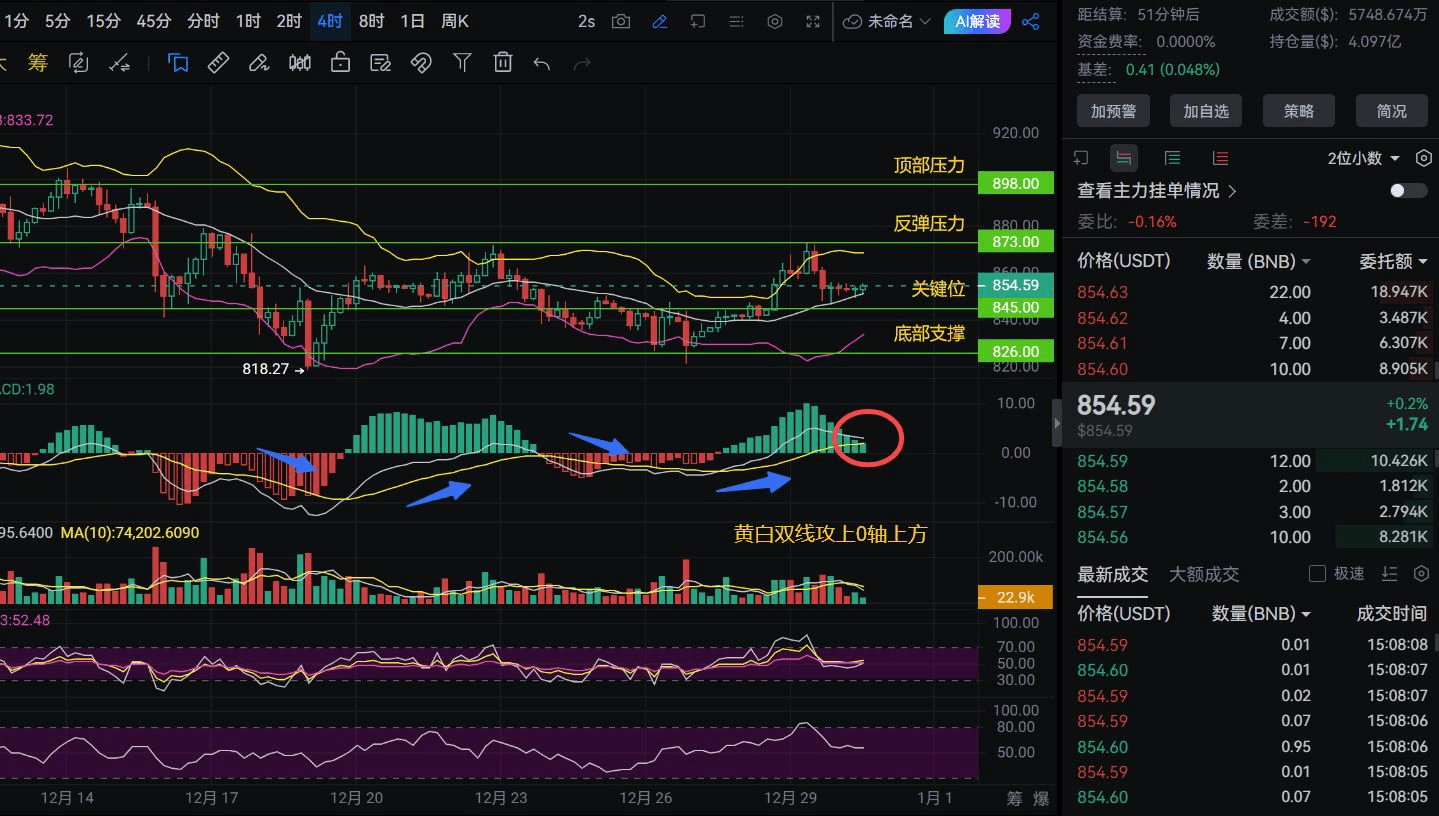
Take a look at this 4-hour chart; several key positions are quite clear:
Upper pressure: 898.00, 880.00 Key position: 845.00 Lower support: 826.00
The current price is 854.59, right in the middle. According to pure trend theory, a downward fluctuation should be bearish, but with MACD above the 0-axis, this is usually interpreted technically as insufficient downward momentum, or even a potential bullish signal.
This is awkward; the indicators and trends are at odds. Who should we listen to?
What should players do tonight? If you are heavily invested and stuck:
Don't blindly cut losses around 854. If your position is too heavy, a rebound to the 865-870 area is an opportunity to reduce your position, not to add to it. Remember, any rebound in a downtrend is an opportunity to adjust your position structure.
If you are lightly invested and want to enter:
Now is not the time for a big bet. Set two alerts: consider starting to buy in batches if it breaks below 845, and increase your position near 826. If there is an unexpected strong breakout above 873 and it stabilizes, follow up when it confirms on a pullback.
If you are out of the market and observing:
Here's a simple method: draw two lines at 845 and 873. If the price is between these two, just watch and don't act; if it breaks any side and stabilizes with 1-2 four-hour candles, then follow the trend.
A detail that has been overlooked
Did you notice the "Funding Rate: 0.0000%" in the chart? Given the continuous new highs in contract positions, this zero funding rate is quite unusual.
This usually means that both bulls and bears are temporarily balanced at this position, but balance is often used to be broken. Combined with MACD being above the 0-axis, which way will this balance ultimately tilt?
My personal opinion: in the short term, it may need to test the key level of 845 again, or even briefly break it, but the probability of directly dropping to 826 is low. The real directional choice may lie within the movements from tonight to tomorrow.
The market is always telling stories, but the candlesticks speak the truth. The conflicting signals of BNB now feel like the calm before a storm. Whether it breaks upward or downward, the pullback after the first signal appears is the relatively safe right-side opportunity.

I am Qi He from the cryptocurrency circle. Follow me for tips on how to catch this wave of market movement and seize full profits! If you're unsure how to time your entry, Qi He will provide real-time analysis in the village, giving the current best entry points. Find meChat Room