Continuation and reversal patterns in technical analysis.
🎯 Class objective:
Identify patterns that anticipate whether a trend will continue or change direction, and learn practical rules to validate them before trading on Binance.
📚 Content:
▶️ Key concepts:
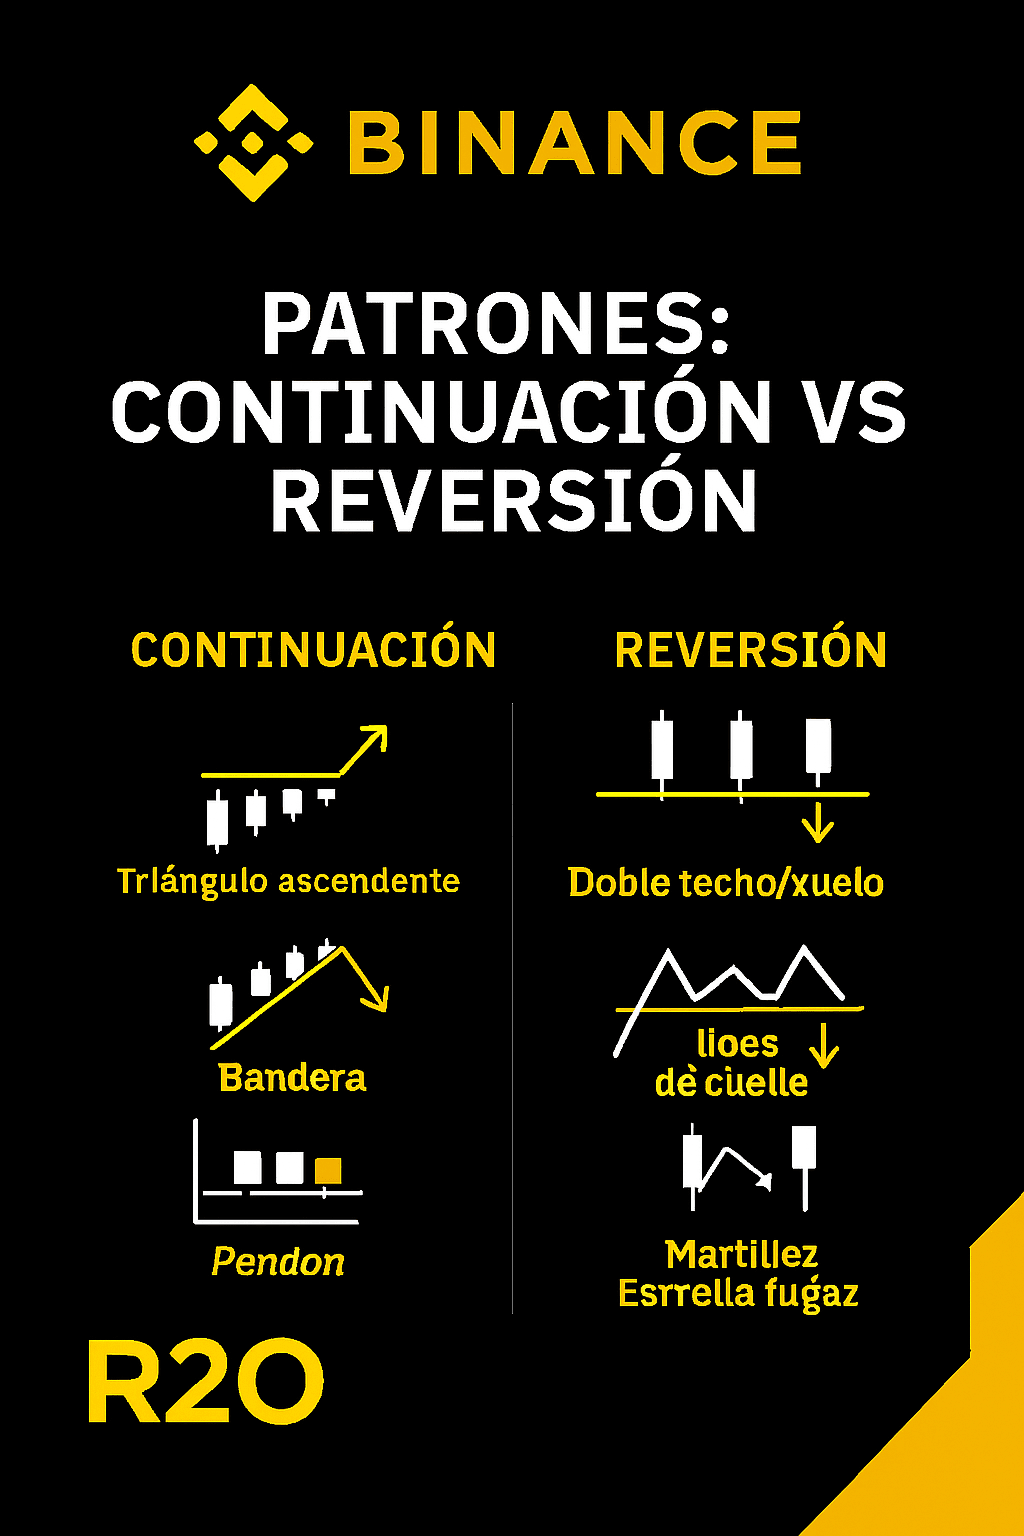
▪️Continuation patterns: Triangles, Flags, and Pennants usually indicate that the current trend will continue after a pause.
• Ascending triangle: equal highs + rising lows ➡️ probability of bullish breakout.
• Bullish flag: small correction in a descending channel after a strong impulse ➡️ continuation upwards.
• Pennant: brief consolidation in the shape of a small triangle after an impulse ➡️ continuation in the same direction.
▪️Reversal patterns: Double top/bottom, Head and Shoulders (HCH) and Hammer/Shooting Star suggest a trend change.
• Double Top: two similar highs with rejection ➡️ possible bearish reversal upon breaking the "neckline."
• Double Bottom: two similar lows with rejection ➡️ possible bullish reversal upon breaking the "neckline."
• HCH: three peaks with the central one being the highest ➡️ breaking the neckline confirms bearish reversal.
• Hammer (bullish)/Shooting Star (bearish): candles with long wicks showing strong rejection at key areas.
▶️ Tip R2O:
A pattern without context is noise. Place it within the trend, near support/resistance levels and with volume backing it.
▶️ How to validate them before trading:
1. Trend context:
• Continuation: the pattern appears after a clear impulse in the same direction.
• Reversal: the pattern arises in exhaustion zones (relevant resistances/supports).
2. Clean structure:
• Well-defined lines (channels, triangles, "necklines").
• Candles coherent with the pattern (without excess noise).
3. Volume:
• Breakout with increasing volume increases fragility.
• Breakouts without volume tend to fail or be false.
4. Entry and Exit:
• Entry: at the confirmed breakout (close above/below).
• Stop Loss: behind the last minimum/maximum of the pattern.
• Take Profit: project the height of the pattern (range measurement) from the breakout point.
▶️ Practical examples:
• Bullish flag in #BTC: Impulse of $40,000 ➡️ $42,500, pause in descending channel; breakout with volume ➡️ continuation towards $44,000 - $45,000.
• Double bottom in #BNB: Two lows near $300 with clear rejections; breakout of the neckline at $310 with volume ➡️ projected target = height of the range.
• HCH in #ETH: Left shoulder $2,250, Head $2,350, Right shoulder $2,260; breakout of the neckline at $2,200 with volume ➡️ bearish bias.
▶️ Tip R2O:
Do not chase the breakout; wait for the confirmation close and protect with a stop loss. Patience pays more than anxiety.
📢 Call to action (CTA)
🔎 Identify a pattern on your Binance chart and comment with #R2O: "I can already distinguish continuation vs reversal."
#CryptoFinanzas #BinanceDesdeCero