


Syrop (SYRUP) has risen more than %2 so far on Friday, extending gains above the 200-day exponential moving average.
Maple Finance recorded record revenues of $2.49 million in December, while managed assets (AUM) remain above $4.28 billion.
Technical outlook remains bullish as trend momentum stabilizes.
Maple Finance (cc-54/) is up by %2 as of Friday's publication, trading above the 200-day exponential moving average at $0.3853. The protocol's lending revenue reached a record high of $2.49 million in December, highlighting accelerating adoption and user demand. Technical outlook for SYRUP suggests further gains, as momentum indicators point to a stable uptrend.
Maple Finance revenue rises with ecosystem expansion
Maple Finance revenue, primarily generated from lending fees and yield optimization, reached a record $2.49 million in December. The protocol's steady revenue flow surpassed $15 million in 2025 overall, signaling increased adoption in the market, particularly from financial institutions.
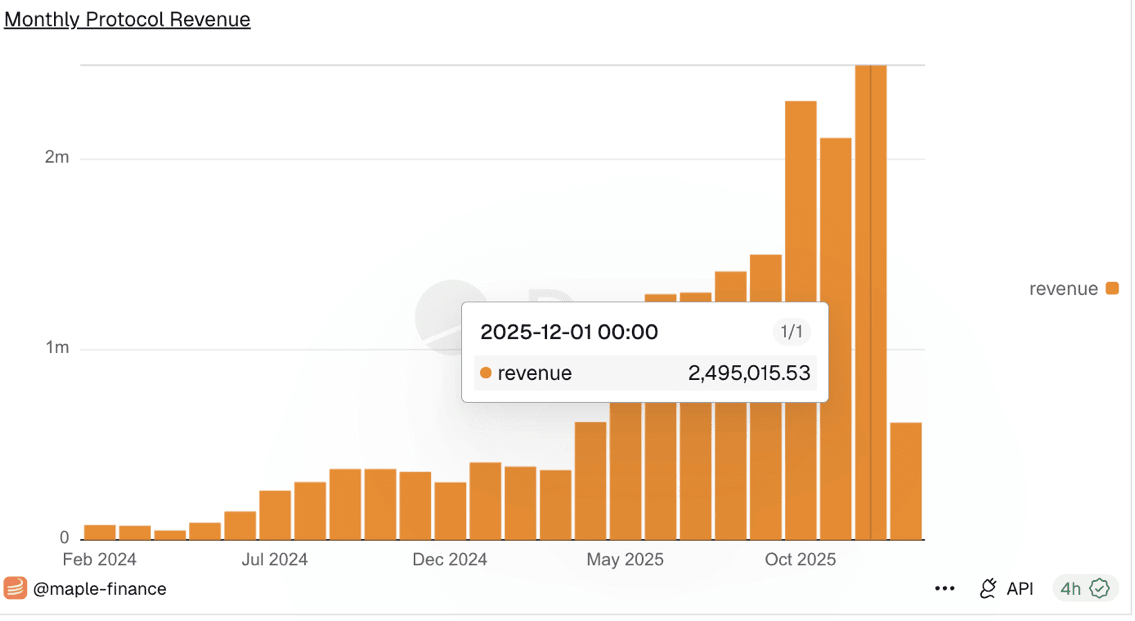
Monthly Maple Finance revenue. Source: Dune
Meanwhile, the protocol's managed assets (AUM) exceed $4.28 billion, with outstanding loan balances of $1.18 billion. This growth in managed assets and revenue highlights the expansion of the Maple Finance ecosystem, which may translate into increased demand for its native token, $SYRUP .
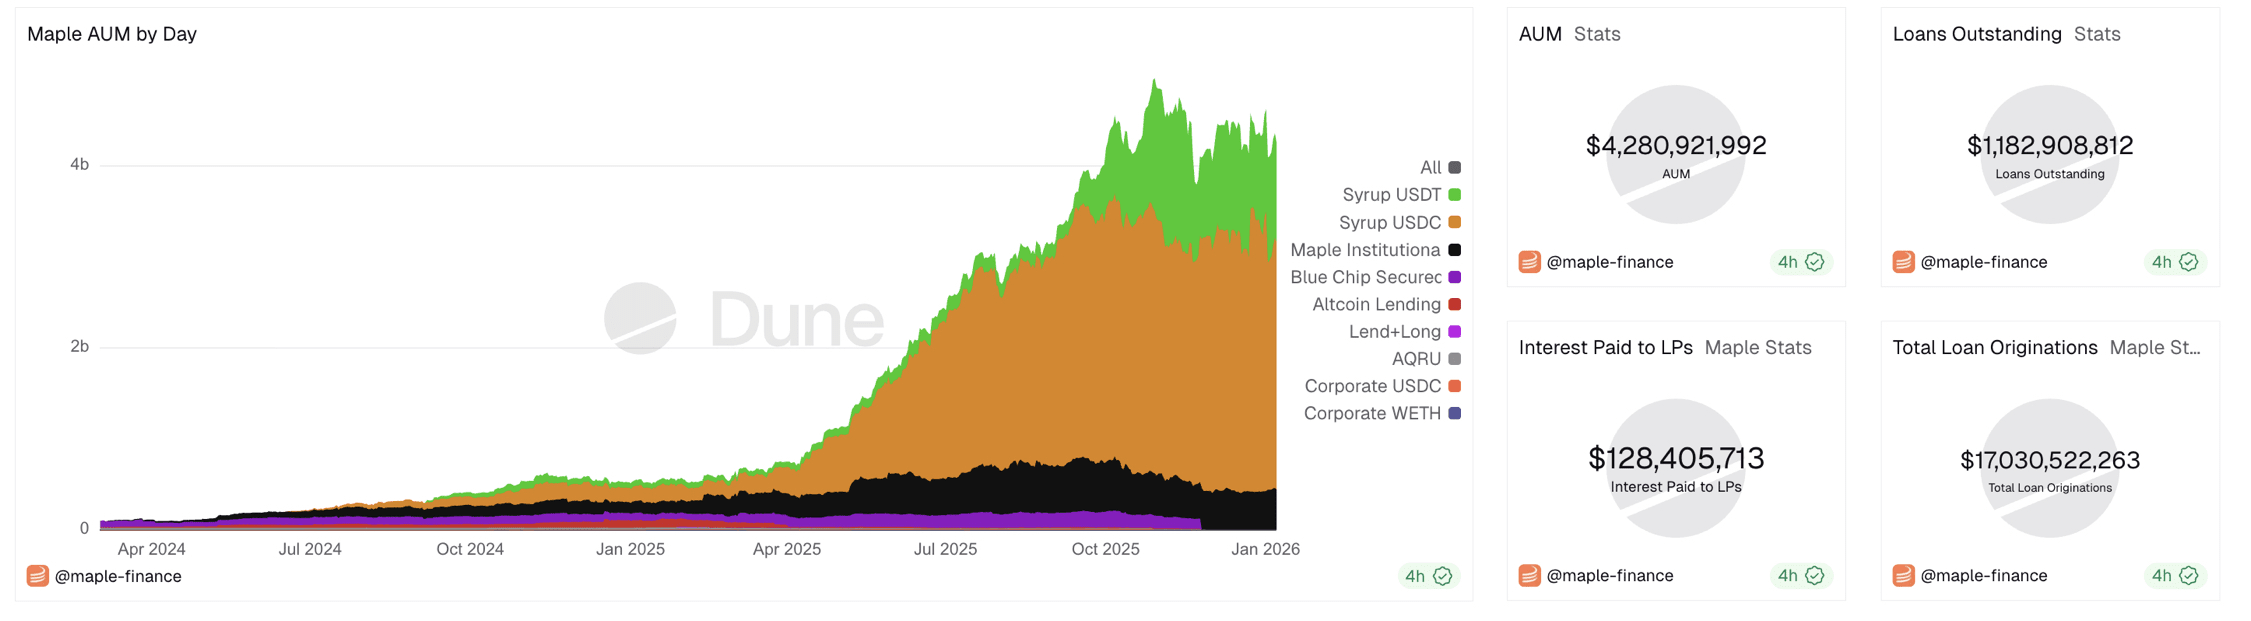
Data from Maple Finance Protocol. Source: Dune
SYRUP poised for an extended rally
SYRUP continues its gains above the 200-day exponential moving average at $0.3853, up by %2 as of Friday's publication, reaching nearly %6 so far this week. This marks the second consecutive week of gains following last week's rebound of %14.
The protocol lending token struggles to sustain its recovery above the round figure of $0.4000, which recently capped Tuesday's rise. However, a decisive close above this level could target the R2 pivot point at $0.4297, followed by the R3 pivot point at $0.4991.
Technical indicators on the daily chart show mixed signals amid the ongoing rise. The Relative Strength Index (RSI) at 67 is elevated toward the overbought zone, indicating increased buying pressure. Meanwhile, the Average Directional Index (ADX) stabilizes around 28, suggesting a stable trend.
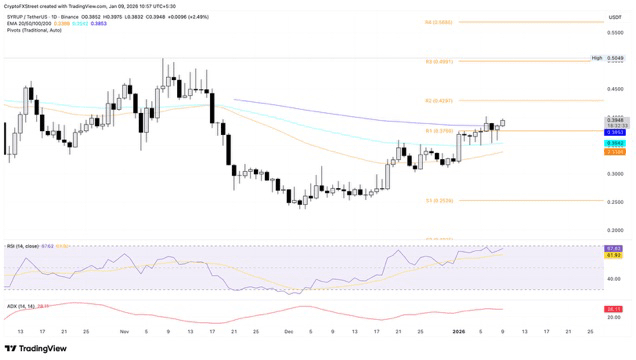
Daily chart of SYRUP/USDT price.
If the price drops below the R1 pivot point at $0.3760, which is close to the 200-day exponential moving average at $0.3853, then the 100-day and 50-day exponential moving averages at $0.3542 and $0.3388 may act as support levels.
#SURUP #BinanceSquareFamily #BinanceSquare #Binance #BinanceSquareTalks