Key metrics (HK time 16:00, Jan 5 → Jan 12)
BTC/USD -1.0% (from $92,600 to $91,700)
ETH/USD -0.5% (from $3,165 to $3,150)
The BTC spot market continued its sideways consolidation pattern since late November, with declining realized volatility over time frustrating both bulls and bears. Price action can be viewed as moving within a wedge pattern, which probabilistically leans slightly toward a final downward move (followed by a reversal), but given the strong support levels observed over the past two months, this may also be part of a longer-term and more complex upward correction. There is no clear conclusion yet, but overall we believe downside potential (in both magnitude and volatility) from the current level will be limited, while upside could offer greater terminal movement potential—though we do not expect explosive price moves or volatility. A move below $89,000 or above $95,000 could catalyze a breakout from the current consolidation/wedge pattern, so we recommend patience as the market attempts to determine its next direction.
Market Theme
The first full trading week of 2026 ended with generally muted price movements across asset classes, as the return of 'full liquidity' brought normalcy to the extreme intraday volatility seen during the holiday period (e.g., in precious metals). The macro backdrop remains broadly supportive of risk appetite, with the S&P 500 hitting a new all-time high, just below the psychological $7,000 level, closing around $6,966. Despite ongoing geopolitical noise (Venezuela, Iran, Greenland), these narratives are difficult to reflect in daily trading, as market participants focus on more structural positioning for the coming year, ignoring short-term distractions.
Cryptocurrencies again lagged behind the broader risk asset trend, losing momentum at BTC's key $94,000–$94,500 resistance level after a positive start to the year. For most of last week, ETF flows turned net outflows, reversing the $1 billion net inflow recorded in the first two days of the year, resulting in flat year-to-date net inflows. From an asset allocation perspective, even at current levels, the market still appears to favor gold as a hedge against dollar depreciation, while for equities/risk appetite, investors remain more inclined to directly allocate to stocks. Until there is clear evidence of upward momentum/volatility or a structural catalyst shift (e.g., the U.S. purchasing BTC as a reserve asset), under the current mechanism, cryptocurrencies may continue to be overlooked in favor of other assets.
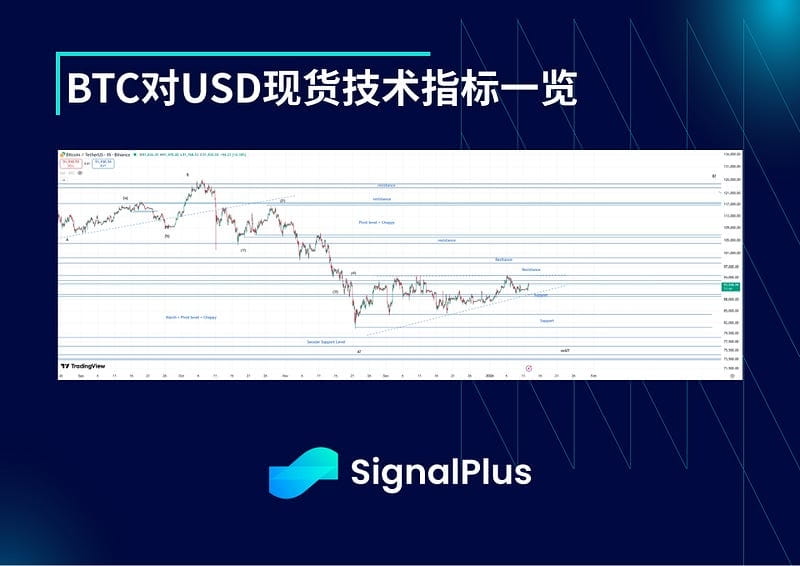
BTC USD ATM Implied Volatility
Implied volatility generally declined last week, as realized volatility remained within the 30–35% range, and the upward buying momentum that started年初 has faded (in fact, after failing to break $94,000, capital flows have shifted toward selling/unwinding long volatility positions).
The term structure of implied volatility has begun to steepen, with short-term daily volatility pricing dropping to around the mid-35% level, aligning with recent realized volatility performance. This inevitably affects all expirations up to the end of January, while daily volatility pricing for the end of January remains at a relatively high level of around 48%, contributing to the steepening effect. As long as prices remain within the $88,000–$94,000 range, front-end volatility may decline rapidly, so we may continue to see pressure on the front end, while further out on the curve, after the high volatility seen in Q4 last year, the market is taking a more cautious stance toward structurally selling volatility at current levels.
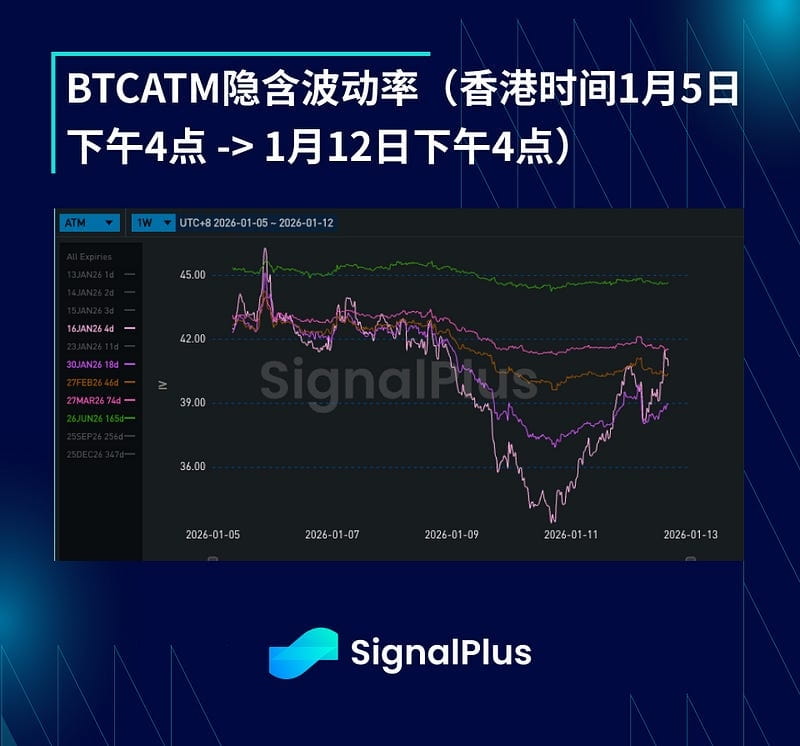
BTC Skew/Kurtosis
As the initial upward momentum faded and supply of upside volatility increased in the market, skew further shifted to the downside over the past week. When prices rose, realized volatility remained flat, but accelerated during spot price pullbacks, indicating a noticeable local correlation between spot prices and realized volatility. However, given cleaner market positions and a macro backdrop still supportive of risk appetite, the market does not appear concerned about a sustained decline in volatility at current levels, which limits the magnitude of skew.
Kurtosis has largely been flat, with prices finding footing within a broad $88,000–$94,000 range. Directional trades on either side of this range have mostly taken the form of call spreads or put spreads, continuously providing downward pressure on kurtosis, while market expectations for a meaningful breakout from this range in the near term remain limited.
Wishing you a successful trading week ahead!