Many friends often confuse RSI with KDJ. I wrote an article that you can take a look at.
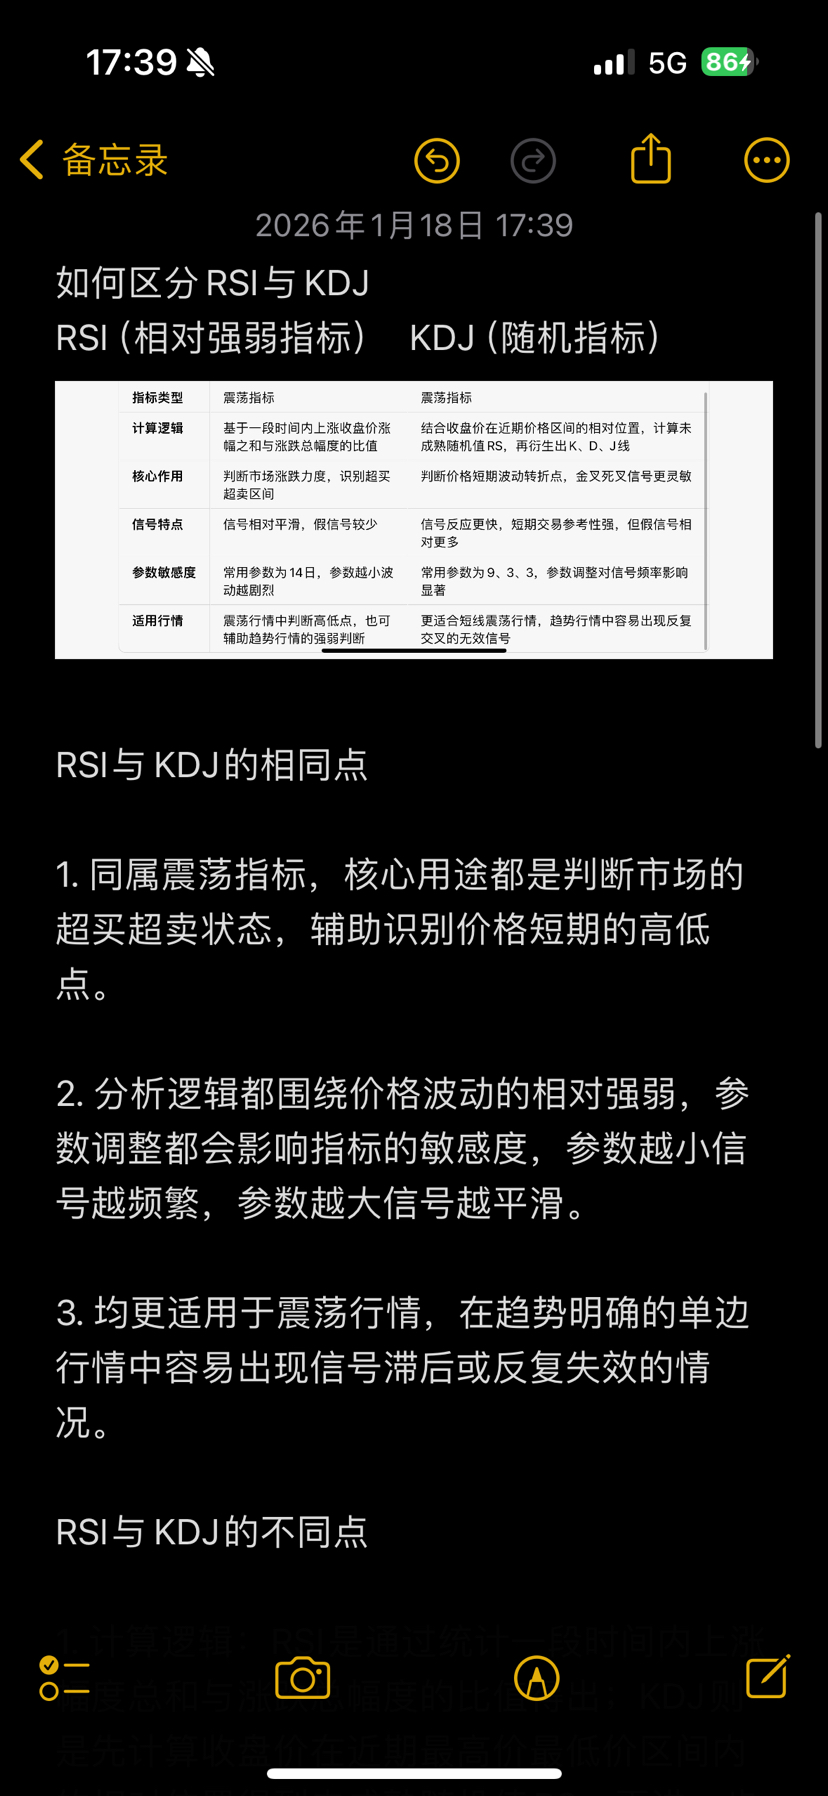
RSI (Relative Strength Index) KDJ (Stochastic Indicator)
Similarities between RSI and KDJ
1. Both are oscillating indicators, and their core purpose is to determine the market's overbought and oversold states, assisting in identifying short-term highs and lows in price.
2. The analytical logic revolves around the relative strength of price fluctuations, and parameter adjustments will affect the sensitivity of the indicators. The smaller the parameter, the more frequent the signals; the larger the parameter, the smoother the signals.
3. Both are more suitable for oscillating markets, and in a clearly trending single-direction market, it is easy to have signal delays or repeated failures.
Differences between RSI and KDJ
1. Calculation logic: RSI is derived by calculating the ratio of the total increase over a period to the total price fluctuation; KDJ first calculates the relative position of the closing price within the recent highest and lowest price range to obtain an immature random value RS, and then further derives the K line, D line, and J line.
2. Signal characteristics: The signals of RSI are relatively smooth and stable, with a lower probability of false signals; KDJ's signals react faster, with earlier triggering of golden and death crosses, but also relatively more accompanying false signals.
3. Common parameters: The conventional parameter for RSI is 14 days; the conventional parameter combination for KDJ is 9, 3, 3, and adjustments to the parameters will have a more significant impact on its signal frequency.
4. Core function: RSI focuses more on measuring the strength of price increases and decreases to assist in judging the continuation of trends; KDJ is better at capturing turning points in short-term price fluctuations, suitable for short-term trading signal references.
RSI (Relative Strength Index)
It is an oscillating indicator that measures the ratio of the magnitude of stock price increases over a period to the total magnitude of price fluctuations, with a range of 0-100 and a common parameter of 14 days. Its core function is to assess the strength of stock price fluctuations and overbought/oversold conditions, with values above 70 typically regarded as overbought and below 30 as oversold; the signals are relatively smooth with fewer false signals.
KDJ (Random Indicator)
It is an oscillating indicator calculated based on the relative position of closing prices within recent high and low price ranges, containing three curves: K line, D line, and J line, with a common parameter combination of 9, 3, 3. Its core function is to capture turning points in short-term stock price fluctuations, providing trading signals through golden crosses (K line crossing above D line) and death crosses (K line crossing below D line), reacting quickly but with relatively more false signals.