Flag Pattern
The flag pattern is a consolidation area that is opposite to the direction of the long-term trend, usually occurring after significant price fluctuations. It looks like a flag on a flagpole, where the flagpole represents the impulsive movement and the flag represents the consolidation area. The flag pattern can be used to identify potential price trends. The volume accompanying the pattern is equally important. A large amount of trading should occur during the impulsive movement, while the trading volume should be smaller and gradually decrease during the consolidation phase.
Rising Flag Pattern
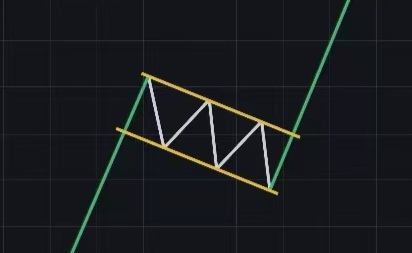
The rising flag pattern belongs to an upward trend, typically characterized by a sharp rise that is expected to continue.
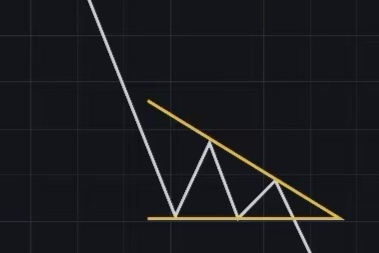
Descending flag
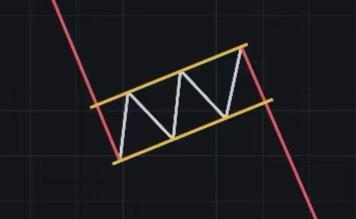
The descending flag typically occurs in a downtrend, taking place during a significant decline and representing a continuation of the decline.
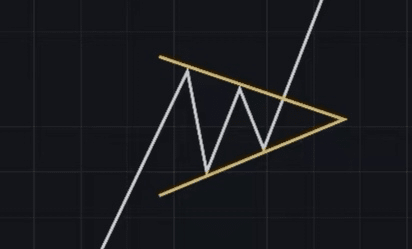
Triangle flag
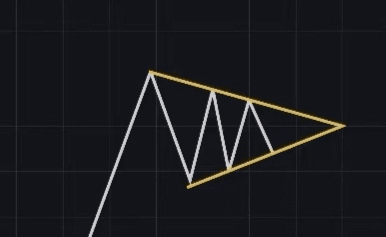
The triangular flag shape is a variant of the flag shape, with a consolidation area featuring converging trend lines, more similar to a triangle. The triangular flag shape belongs to a neutral pattern; its interpretation largely depends on the specific context of the pattern.
Triangle
In triangle patterns, the price range gradually converges, and is usually accompanied by a consolidation trend. The triangle itself represents a pause in the trend, but it can sometimes indicate a reversal or continuation.
Ascending triangle
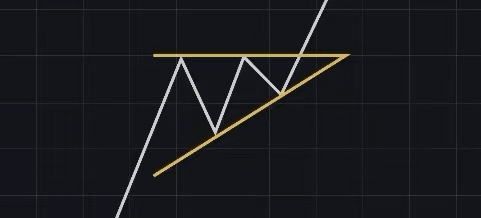
An ascending triangle is formed when there is a resistance area and the ascending trend line crosses higher points. Essentially, whenever the price rebounds from the resistance area, buyers will enter at higher prices to create higher locations. The situation within the resistance area becomes increasingly tense, and when the price breaks through this resistance zone, a sharp increase in trading volume will occur. Therefore, the ascending triangle becomes a bullish pattern.
Descending triangle
The descending triangle is the inversion of the ascending triangle. This pattern is formed when there is a horizontal support area and the descending trend line crosses lower highs. Like the ascending triangle, whenever the price rebounds from the horizontal support level, sellers will enter at lower prices to create lower highs. Typically, if the price breaks through the horizontal support level, the trading volume will decrease significantly. At this point, a bearish pattern is formed.
Symmetrical triangle
The symmetrical triangle is formed by a descending upper trend line and an ascending lower trend line, both of which have approximately the same slope. A symmetrical triangle is neither a bullish nor a bearish pattern, as its interpretation largely depends on the surrounding environment (i.e., the underlying trend). In itself, it is a neutral pattern representing a period of consolidation.
Wedge
The wedge pattern consists of converging trend lines, indicating a tightening price trend. In this case, the highs and lows of the trend lines have risen or fallen at different rates.
It may indicate an impending reversal, as the underlying trend is gradually weakening. The wedge pattern will be accompanied by a decrease in trading volume, and the timely trend will lose momentum.
Rising wedge
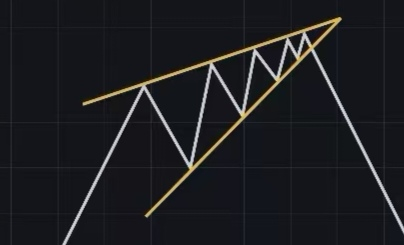
The rising wedge represents a bearish reversal pattern. It indicates that as the price tightens, the upward trend is weakening, and it may eventually break through the descending trend line.
Descending wedge
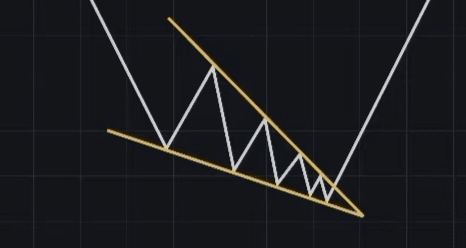
The descending wedge is a bullish reversal pattern. It indicates that as the price continues to fall and the trend lines tighten, the contraction situation is intensifying. Generally, the descending wedge suggests that volatility impulses will break upward.
Double tops and double bottoms
The double top and double bottom patterns form when the market price moves in an "M" or "W" shape. Even if the relevant prices are not exactly the same, as long as they are close to each other, this pattern is valid. Typically, the trading volume occurring at the two low or high points is higher than elsewhere.
Double top
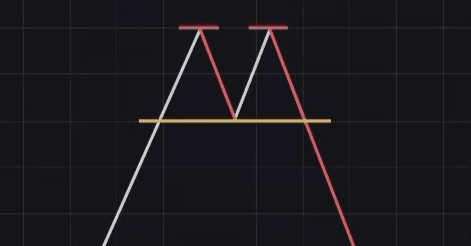
The double top belongs to a bearish pattern, in which the price reaches a high point twice, but cannot break through on the second attempt. Meanwhile, the retracement between the two tops should be moderate. When the price breaks below the retracement low between the two highs, this pattern is formed.
Double bottom
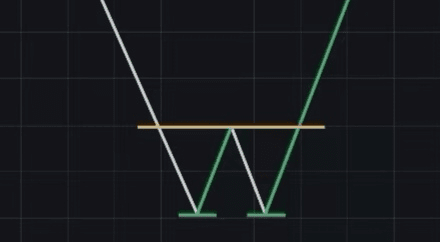
The double bottom is a bullish pattern in which the price reaches a low point twice before finally breaking up to a higher position. Similar to the double top, the rebound between the two low points should be moderate. When the price breaks above the rebound high between the two lows, the high pattern is formed.
Head and shoulders pattern
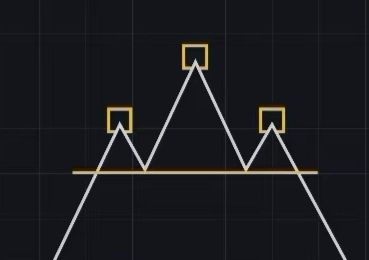
The head and shoulders is a bearish reversal mindset that involves a baseline (neckline) and three peaks. The two side peaks should be at approximately the same horizontal height, while the middle peak should be higher than the left and right shoulders. If the price breaks through the neckline support, this pattern will form.
Inverse head and shoulders
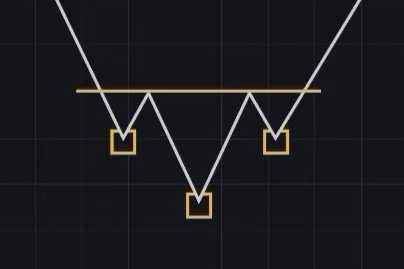
As the name suggests, this pattern is the opposite of the head and shoulders pattern, indicating a bullish formation. In the inverse head and shoulders, the price drops to a lower low and then rebounds, roughly matching the support level of the first low point. When the price breaks through the neckline resistance and continues to rise, this pattern is formed.