What are support and resistance?
From a basic perspective, support and resistance are the simplest concepts: when the price reaches a level that it cannot break through, that level becomes some sort of obstruction. In the case of support, that price is the lowest price, while in the case of resistance, that price is the highest price. You can think of support as a demand area and resistance as a supply area.
Although traditionally support and resistance are represented by lines, the reality is often not so precise. It's important to note that market trends are not driven by certain natural laws that prevent them from breaking through specific levels, which is why viewing support and resistance as a range can be more useful. You can think of these areas as ranges on the price chart that lead to increased trading activity.
Let's look at a case of a support level: we notice that the price continuously enters the area where the asset is being bought. With multiple tests of that area by the market, a support range is formed. Since the bears (sellers) are unable to push the price lower, a rebound occurs, creating a new upward trend.
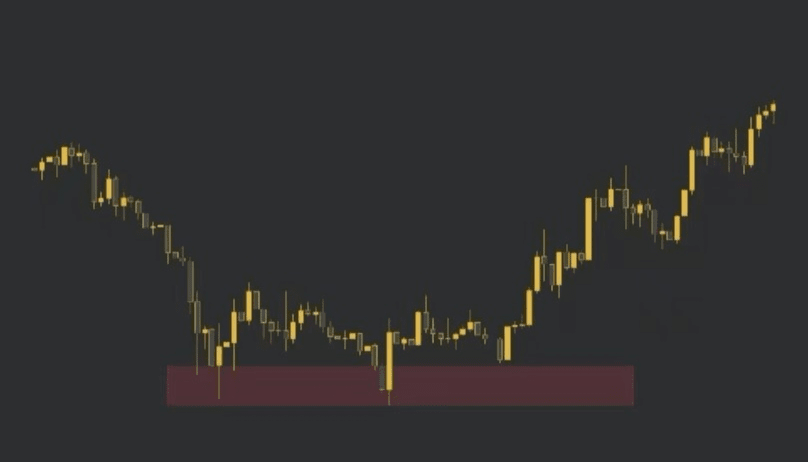
The price oscillates around the support level before rebounding.
Now let's look at the resistance level: we can see the price is in a downward trend, and each rebound fails to break through the same area multiple times. The reason for the formation of resistance levels is that the bulls (buyers) are unable to maintain control of the market to push prices higher, resulting in a continued decline.
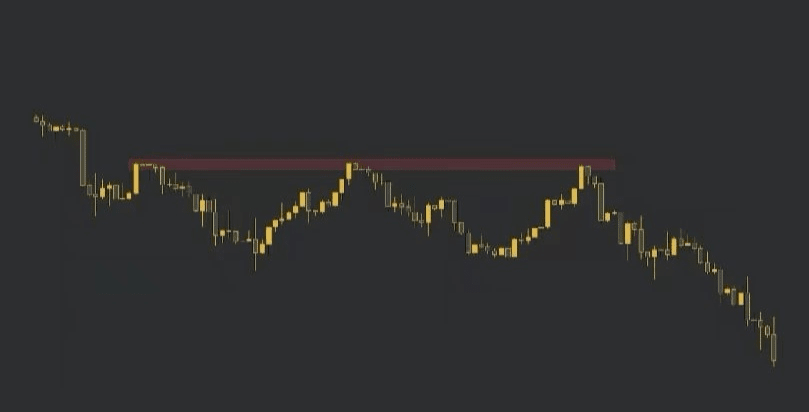
The price cannot break through the resistance level.
How do traders use support and resistance levels?
Typically, we use support and resistance levels to identify areas of interest on price charts. Within this area, the likelihood of a trend reversal or pause is higher.
Market psychology plays a significant role in the formation of support and resistance levels. Traders and investors can often remember previous price levels that generated profits, and since many traders may keep the price at the same level, it increases liquidity in that area. This often makes support and resistance areas ideal entry or exit points for large traders (or whales).
Support and resistance are also key concepts for proper risk management. Identifying these areas can provide favorable trading opportunities. Typically, when the price reaches a support or resistance area, two things happen: the price either rebounds from that area or breaks through and continues in the direction of the trend until the next support or resistance area appears.
Entering trades near support or resistance levels is also a very favorable trading strategy, primarily because this position is relatively close to the stop-loss levels we often set in trading. If that area is breached and the trade is invalid, it can cause a minor loss for the trader. In this sense, the further away the entry point is from the supply or demand area, the further it is from the invalidation point.
Another consideration is how these price levels respond to the constantly changing environment. Typically, a support area that has been broken will turn into a resistance area as conditions change; conversely, if a resistance area is broken, it may become a support level. This pattern is known as support-resistance flip.
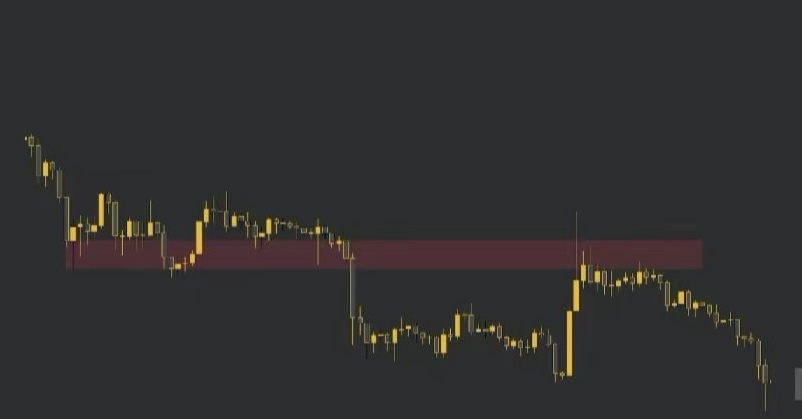
A resistance area is formed after a support area is breached.
The fact that the previous support area has now become a resistance area (and vice versa) also confirms this pattern, and retesting that area may be the most favorable time to enter the market.
Another factor to consider is the strength of the support or resistance area. Typically, the more times the price drops and retests the support area, the greater the chance of a breakdown. Similarly, the more times the price rises and retests the resistance area, the greater the chance of an upward breakout.
Trendline support and resistance
In the following case, the ascending triangle pattern keeps the price rising until a breakout occurs.
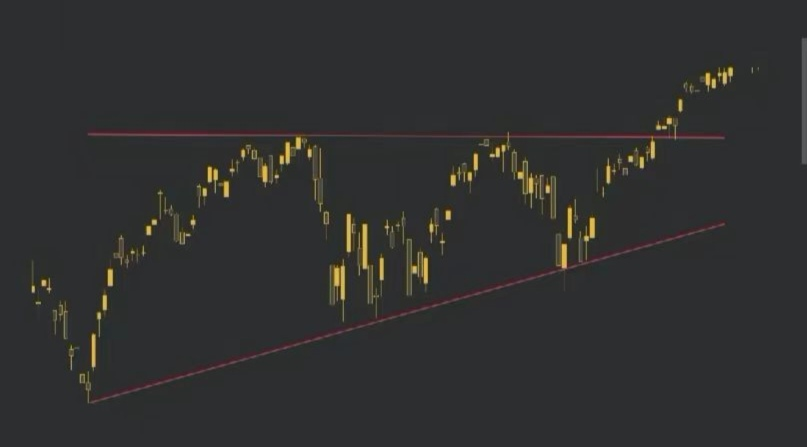
The trendline serves as support and resistance for the S&P 500 index.
You can leverage the patterns of support and resistance areas that align with trend lines to your advantage. Identifying this pattern before it fully develops can be quite useful.
Moving average support and resistance
Many indicators also act as support or resistance for the price.
The most direct case is the moving average. The moving average serves as a support or resistance for the price, and many traders use it as an indicator to measure the overall health of the market. Moving averages are often used to attempt to discover trend reversals or pivot points$BTC
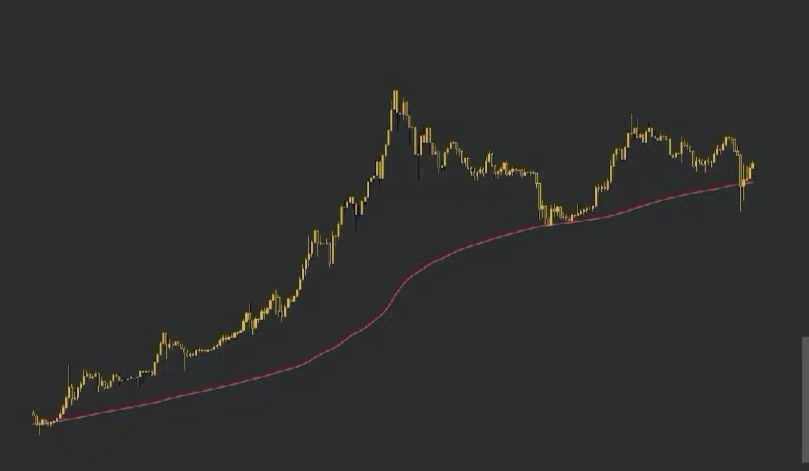
The 200-week moving average serves as a support level for Bitcoin prices.

Fibonacci support and resistance
The horizontal lines described by the Fibonacci retracement tool can also serve as support and resistance.
In the example below, the 61.8% Fibonacci level acts as support multiple times, while the remaining 23.6% serves as resistance.
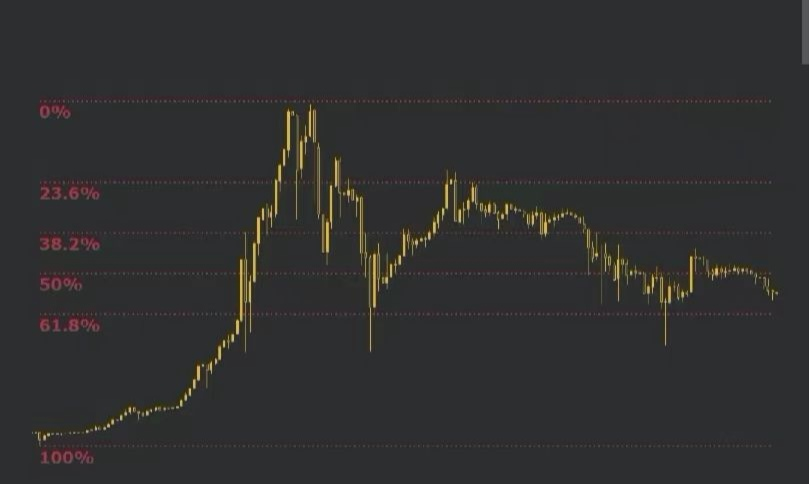
Fibonacci levels serve as both support and resistance for Bitcoin.
Practice makes perfect; the content is for reference only!!

