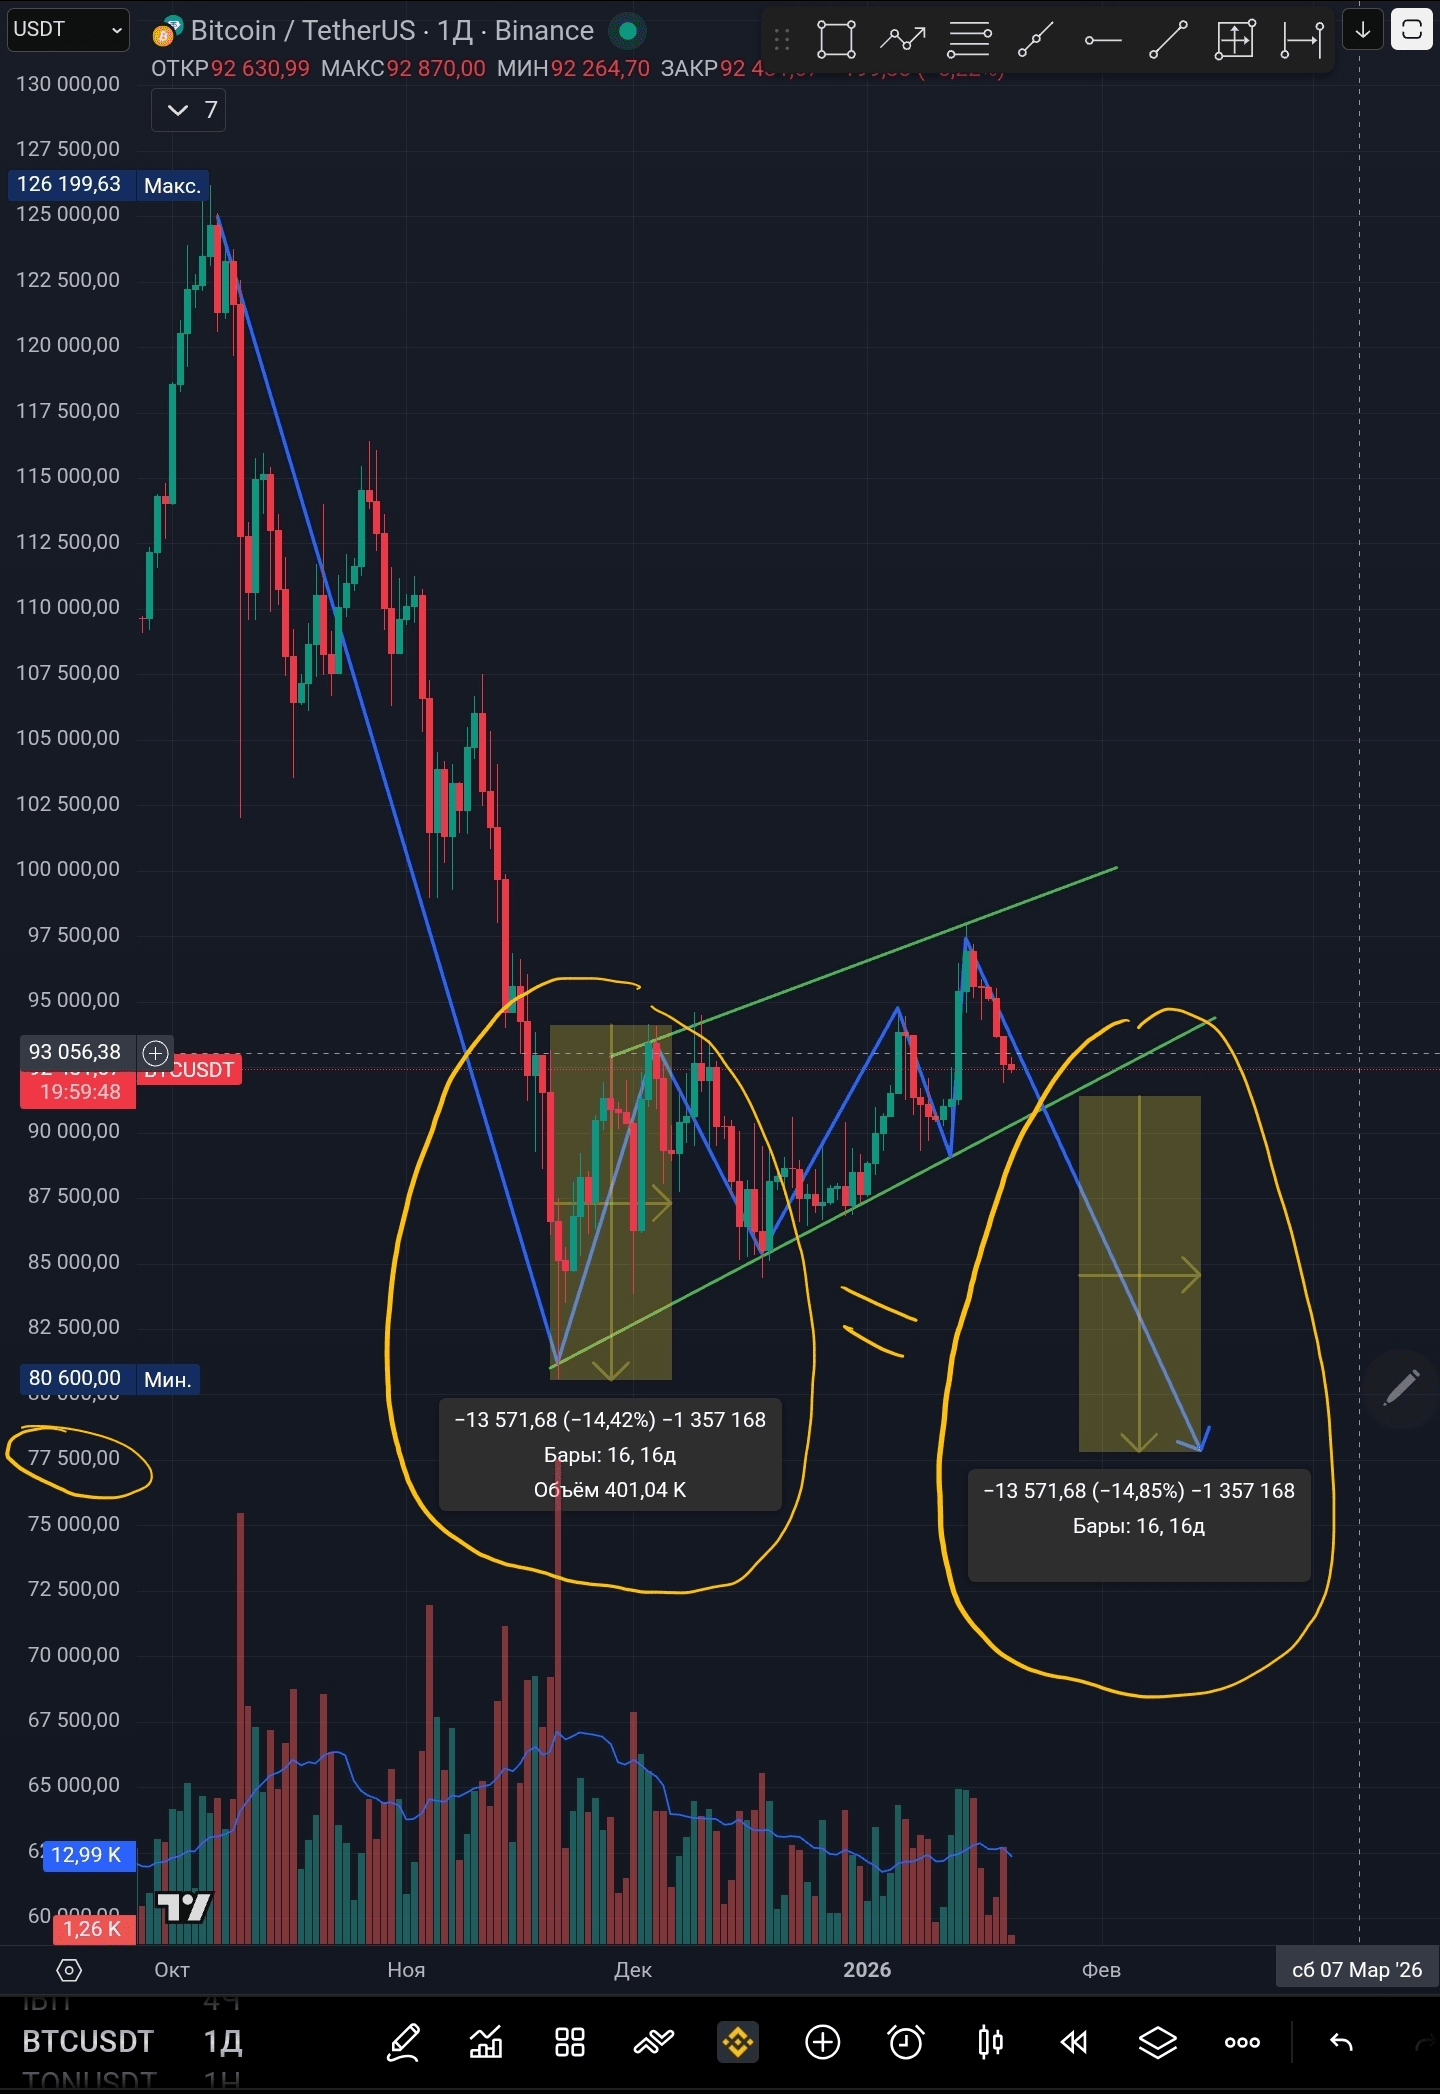
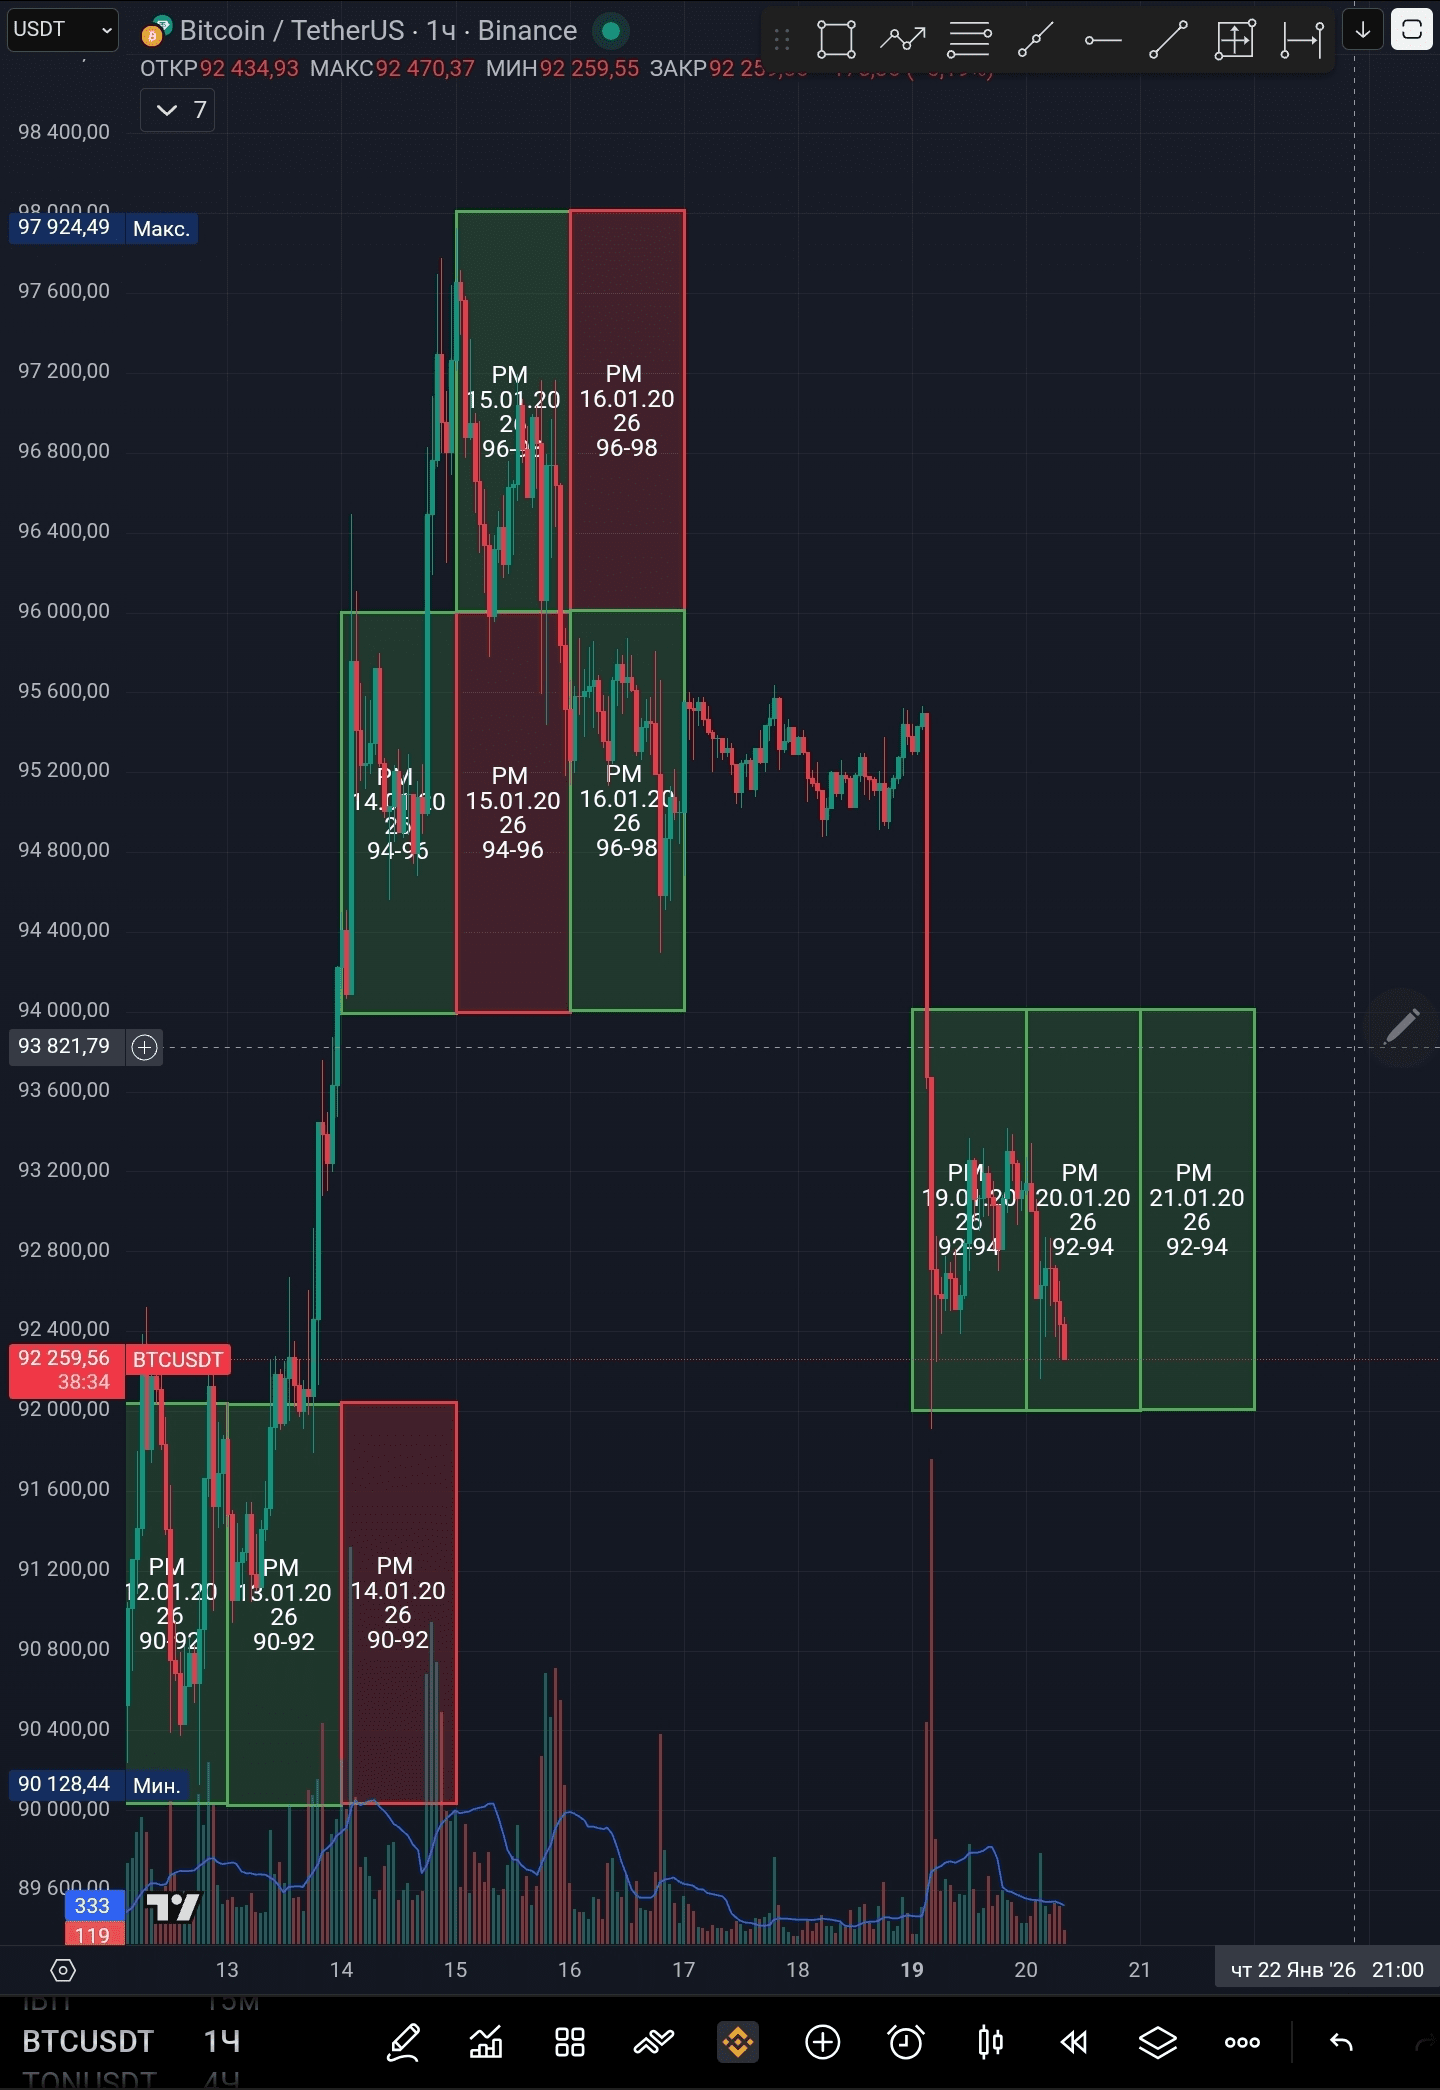
Good morning dear friends, the price is presumably in a continuation pattern of the bearish trend, an Ascending Wedge. If the price breaks out of this figure, according to the theory, it should travel the same distance as from the bottom to the top of the first movement.
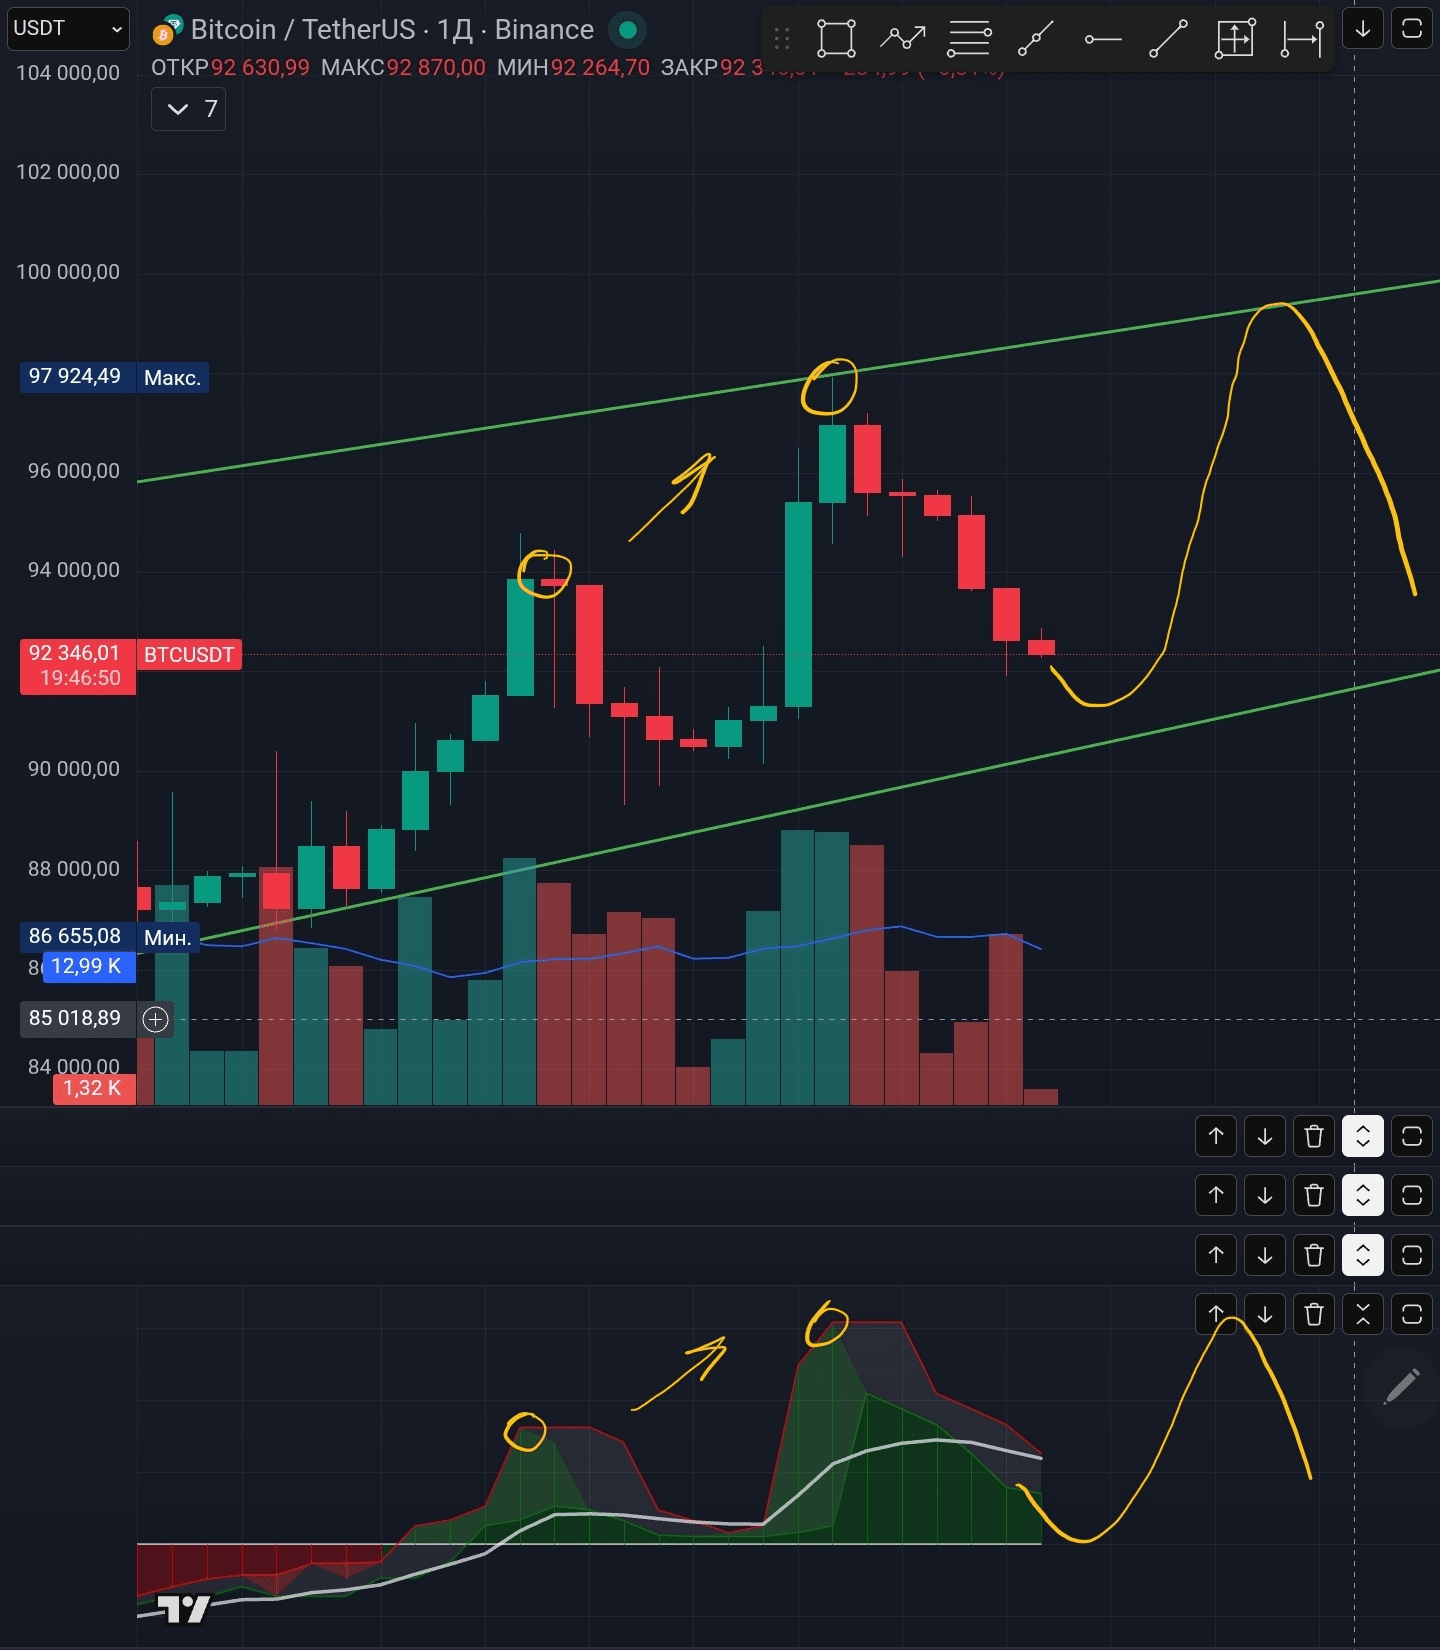
There are initial bearish divergence signals on the MACD histogram, but the possibility of making another high is high.
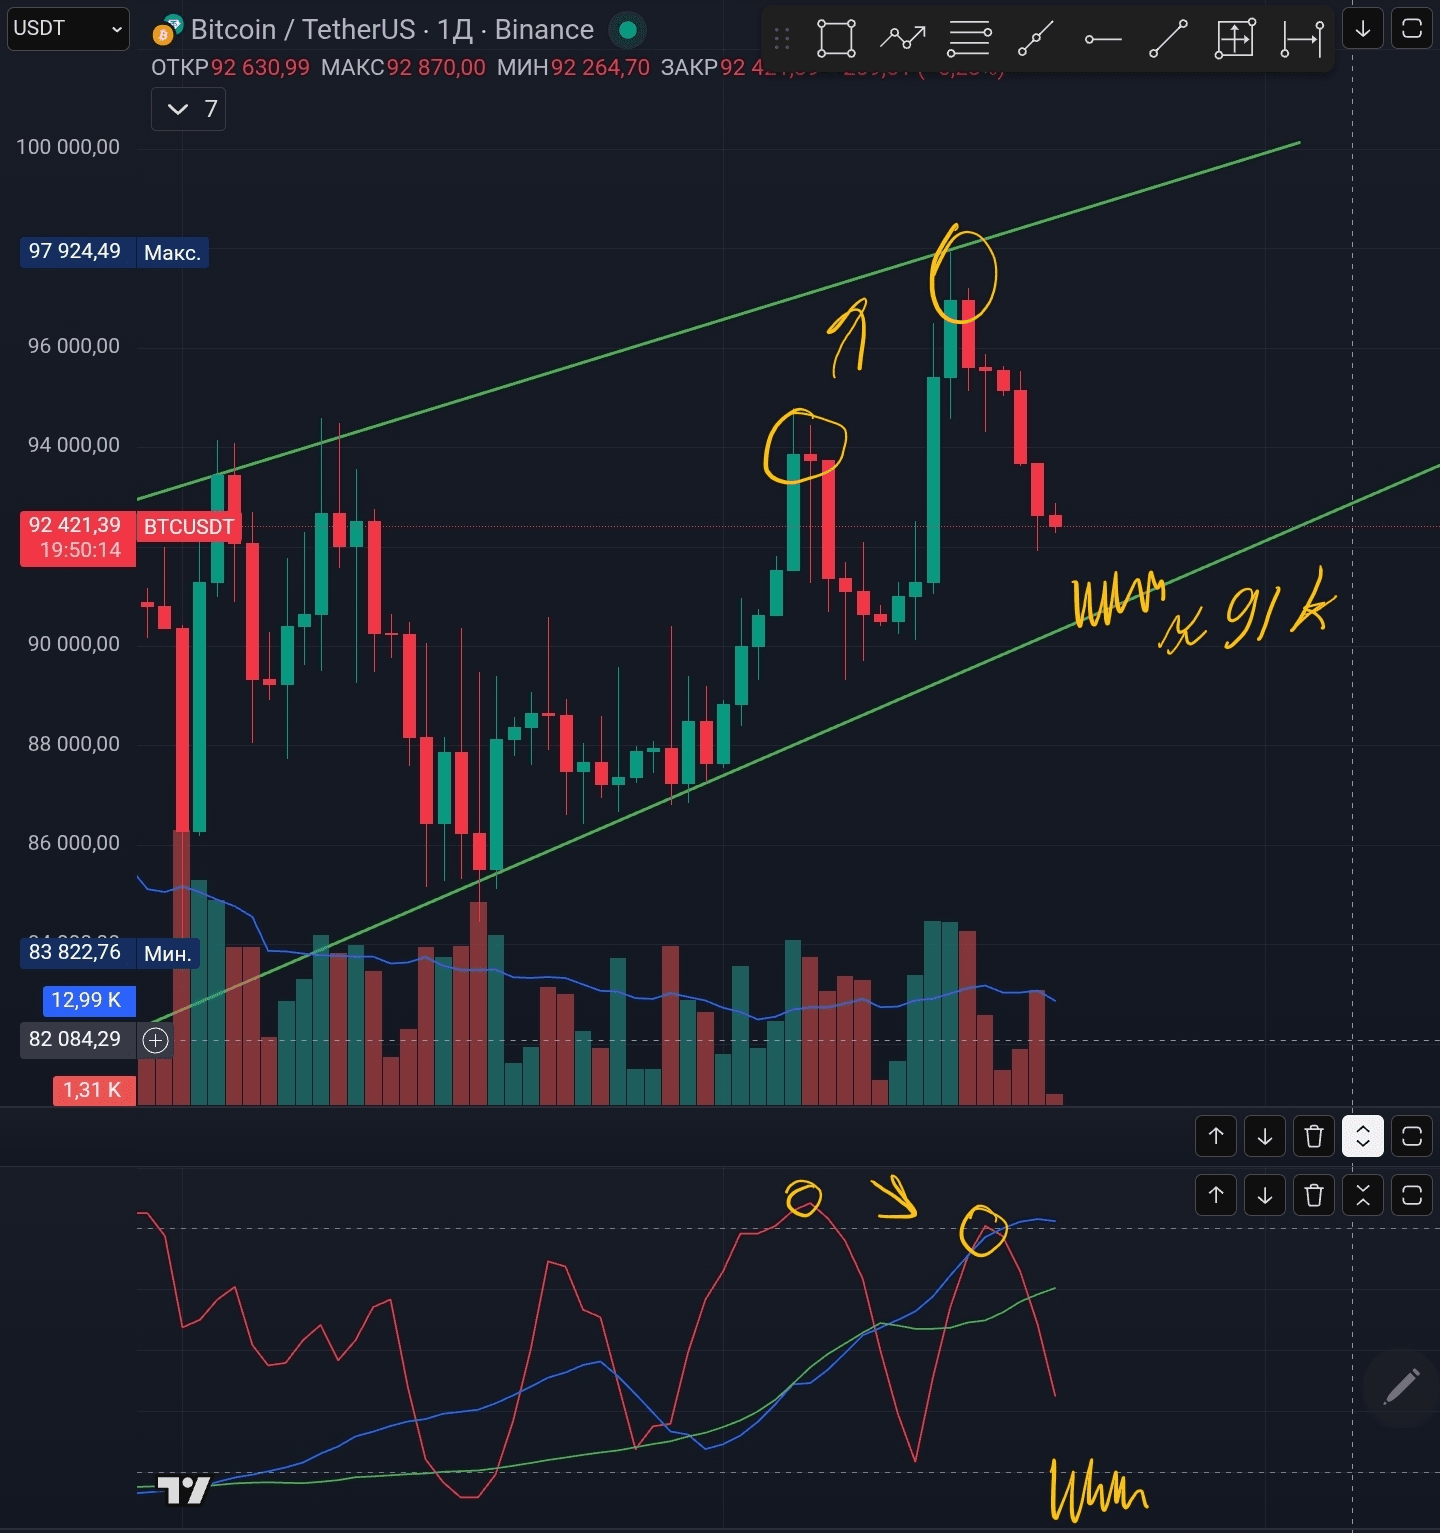
RCI shows divergence, the price is trying to enter the oversold zone.
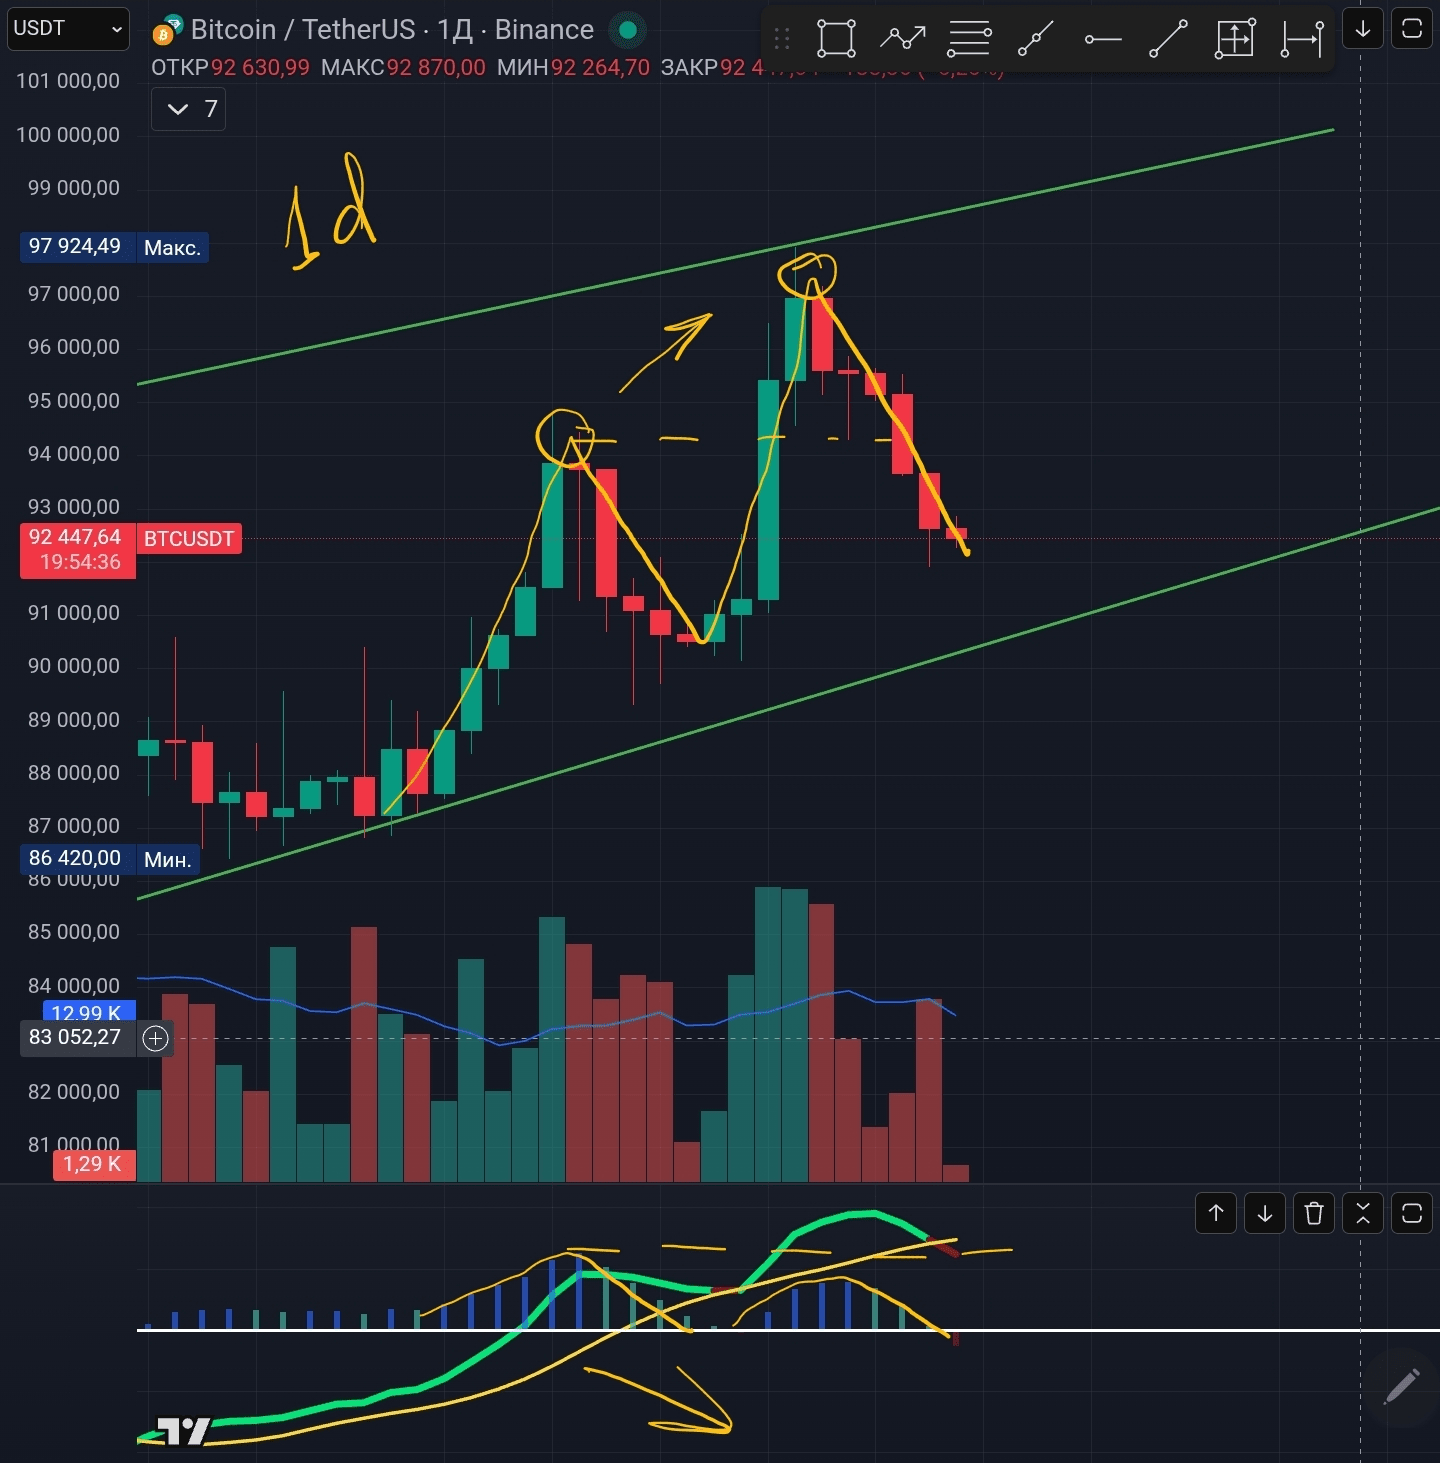
But what the price can do to make another high is indicated by the strength index indicator.
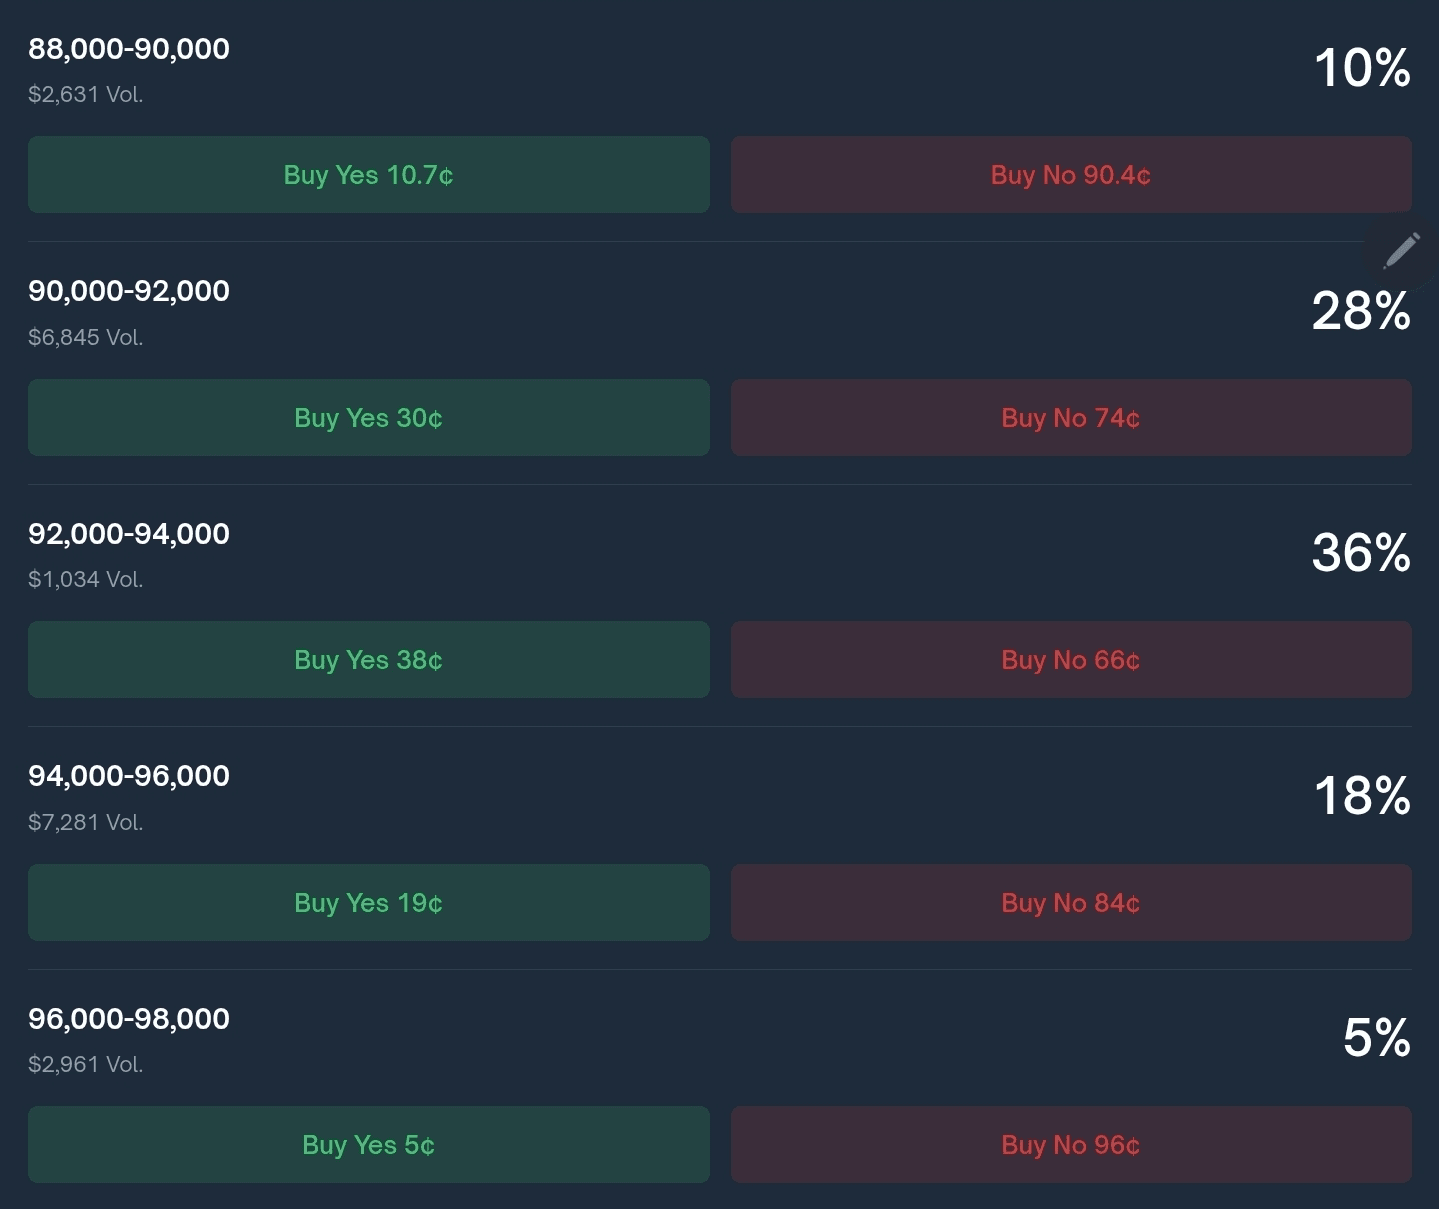
📍The majority forecast in Polymarket for today and tomorrow gives us the most likely price range of 92-94k, people are leaning more towards a decline the next day.
20.01.2026
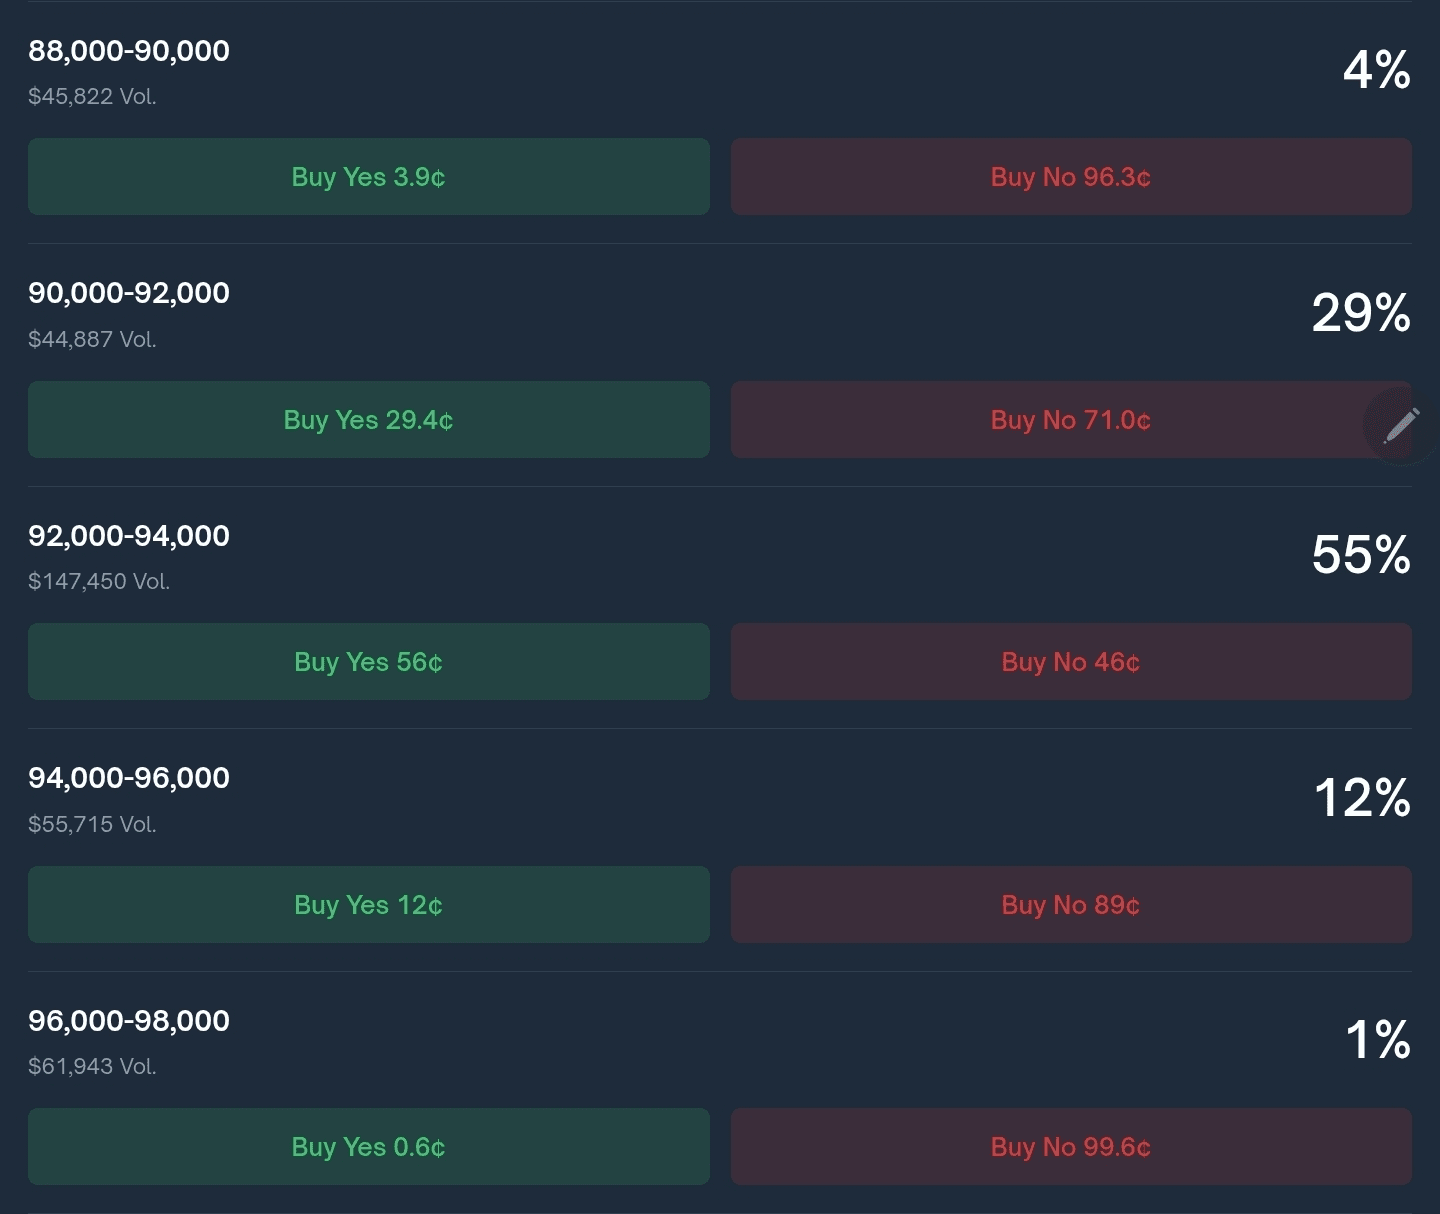
21.01.2026
📍Donald Trump was surprisingly calm in his Truth Social for yesterday, some internal problems migration, Minnesota, election fraud... not interesting for us.
📍My conclusion is as follows: the indicators do not give a clear indication that we are about to break through the Ascending Wedge figure, but the indicators also do not tell us that we will move strongly upwards. The price has chances to make another wave similar to the previous one, but I will not bet on it, the movement feels weak to me and there is a high probability of continuing the bearish medium-term trend. Assess the risks, friends 🙌
✨✨✨
Share your reasoned opinion in the comments. Your feedback, like, and subscription are the best thanks for me! Turn on notifications so you don't miss my daily releases and stay updated. Have a good day, take care of yourself, your wallet, and may you have green P&L my crypto brothers 🙌
