Today we will talk about tools that 90% of newcomers don't know, we will learn where to find whales, and with what leverage they trade🤔💪
✅Tool 1. Many know it - it's the Coinglass service👀
How can it help you❓
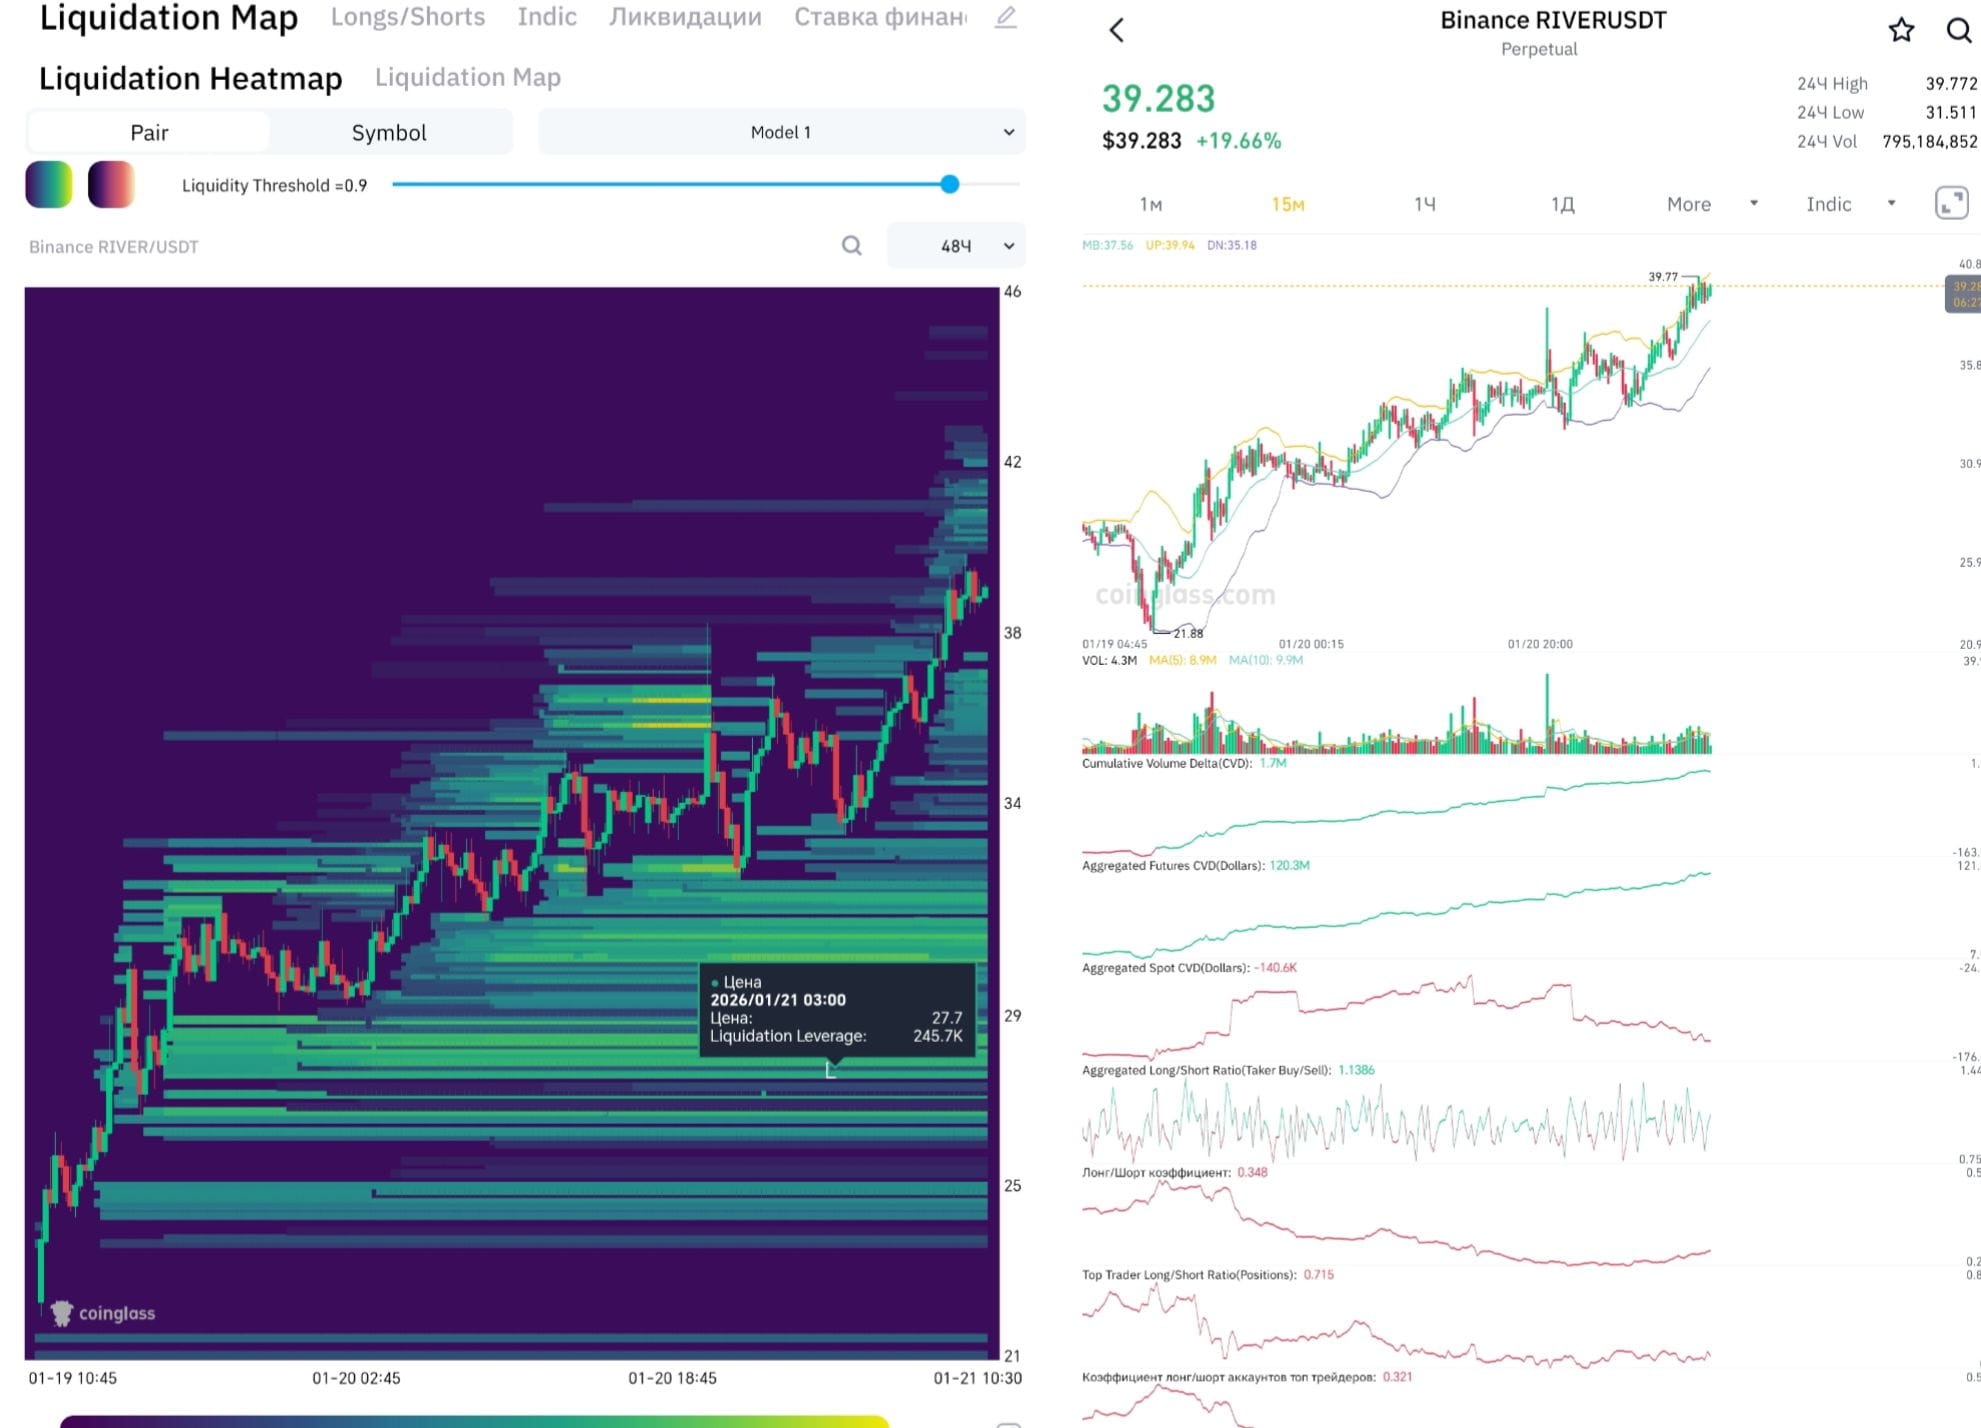
📸The photo on the left is a heat map, it reflects where there is more liquidity and gives an understanding of how low the price can drop👇 or how high it can rise👆
The more liquidity, the yellower the stripes. And liquidity is a magnet🧲. To which the price will be attracted. With the help of this tool, you will find out where long or short positions were approximately opened and where their stop losses are likely to be🛑
How will this help you and my example❗ I was looking for an entry point for Long on $RIVER , by trend lines I saw that probably this price is 17.00-18.00. But the heat map gave specifics🤔 at 16.50 there was a huge amount of liquidity, and the price could potentially reach it, I set the stop below the liquid zones and below the previous low at 16.10, the coin at that moment reached 16.12😂
Attention❗❗❗Do not trust one tool, use all tools in combination❗❗❗
📸Photo on the right, this is the same service, but there you will see besides the chart, many tools and indicators📈. For example, the total CVD and CVD separately for spot and futures, sometimes you can understand why the coin flew up like a rocket🚀, the CVD of the spot increased, meaning large purchases were made, and then futures entered the game and carried the coin to the moon🌕
There are also many other interesting indicators. I recommend looking and studying, very useful☝️
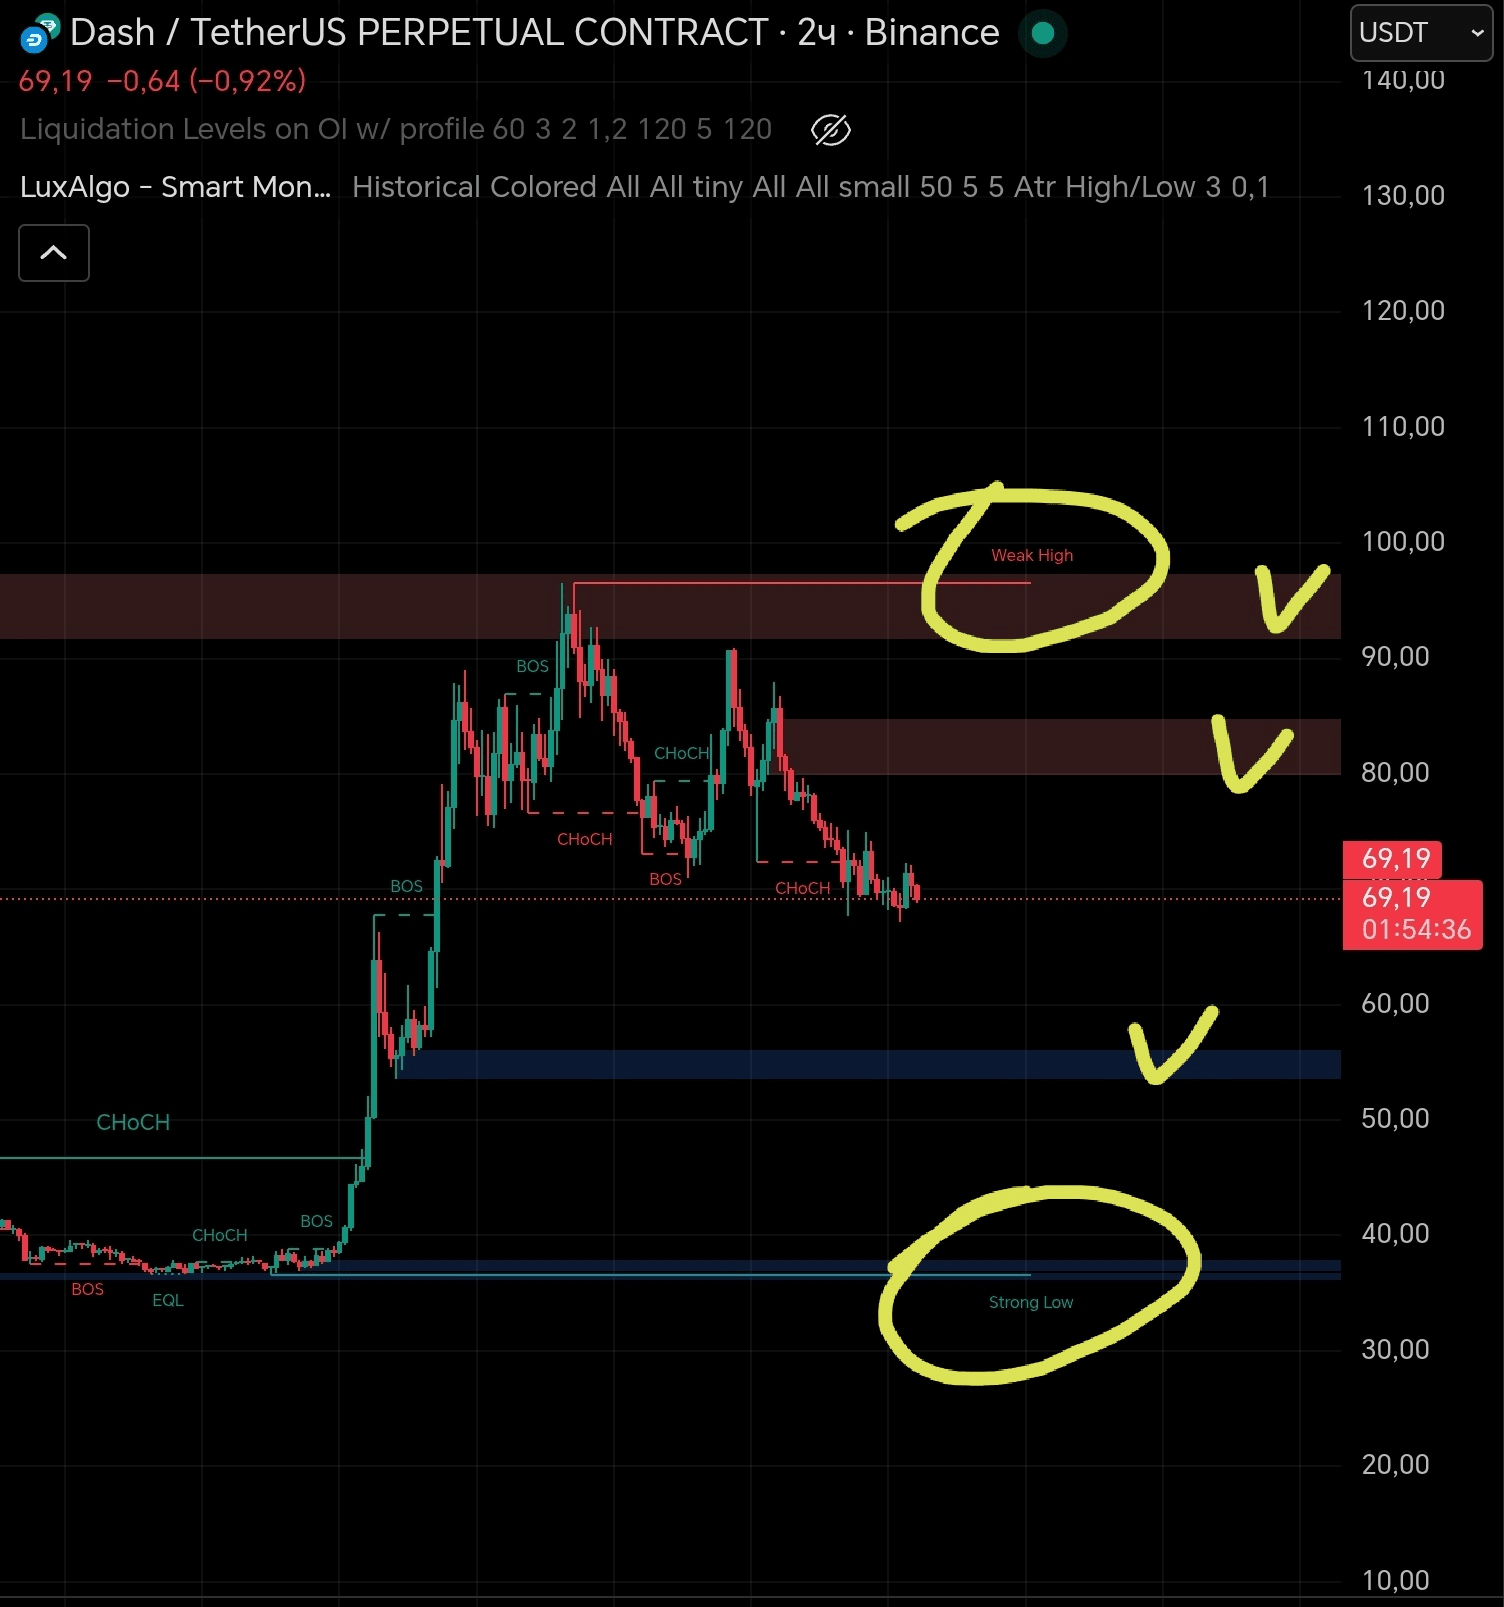
✅Tool 2. My favorite tool on TradingView is called LuxAlgo Smart money💰🧲
What will it tell you🤔:
A) where smart money made purchases and sales, red and blue rectangles👍
B) what is easier for the coin to do, update the past high or break the low❓
In the photo, you see👀 weak high and strong low💪. This means that in the area of low there is powerful support, this indicator worked perfectly on River, at the moment everyone thought: the price will fly to the bottom😱😱😱 it is already 11.50 but in this place there was the previous strong low. And I knew that this point might become a reversal. In this example with $DASH I understand, both by Fibonacci and by Smart money, that we can really see the coin drop to 54-55, strengthen there, create strong support and fly up🚀🚀🚀 Or maybe the coin will reverse from the current values🤔 Price 54-55 is the most negative turn in this situation😔
But you shouldn't believe blindly, this is just one of your tools that can help you❗❗❗
✅Tool 3. Here it gets more interesting. Akhram service.
There you will see what whales are buying and selling🐳, all information about the coin, transactions in real time, and top holders👍
Everything in order:
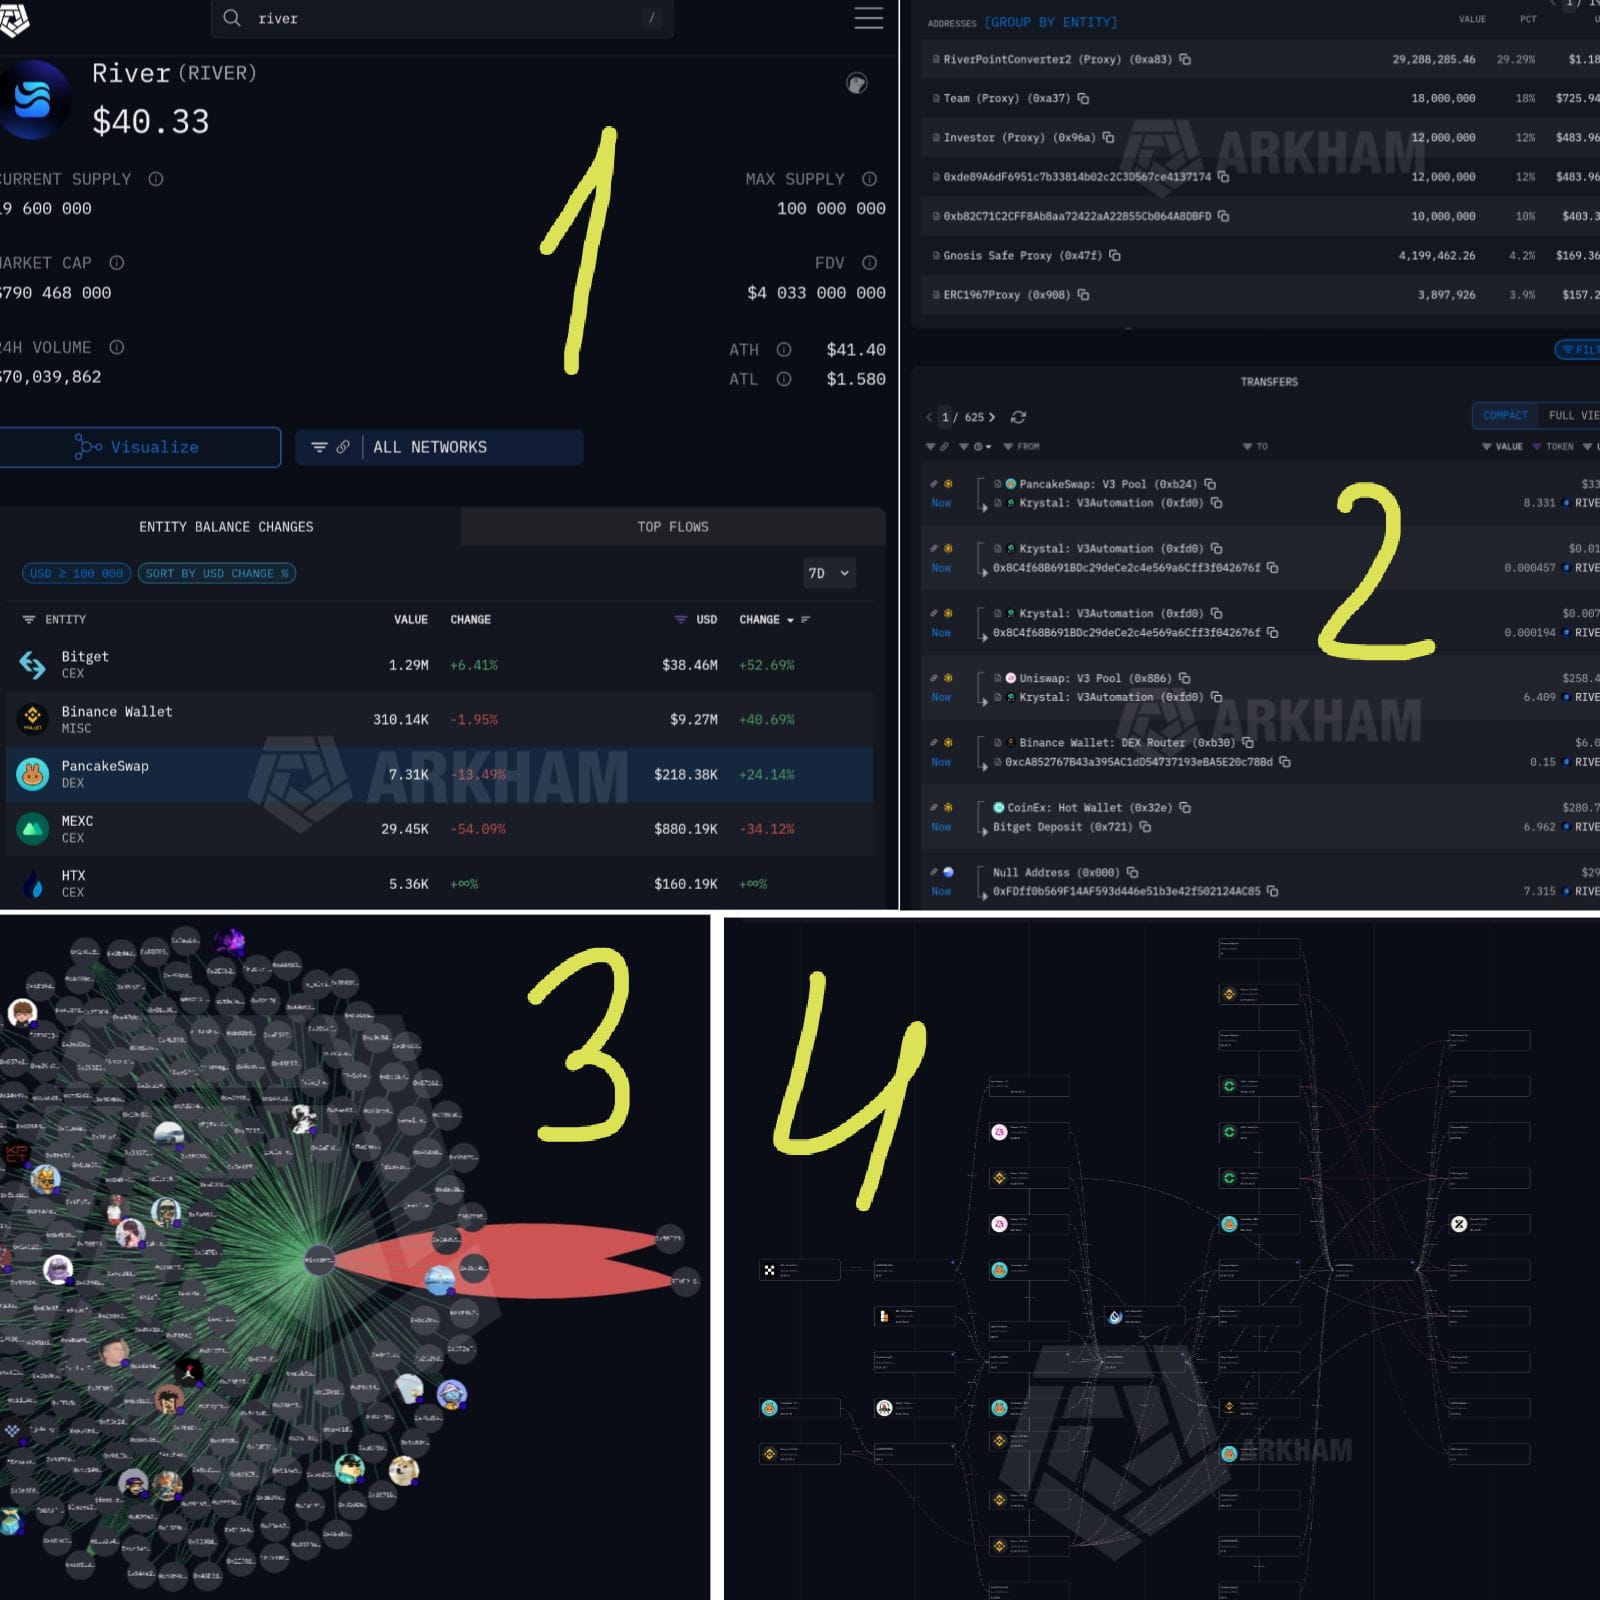
📸Photo marked 1 coin name and all information about it.
📸Photo marked 2 upper part👆 large holders. Lower part👇 purchases and sales in real time⌚ You see who and what amount of coins they brought to the exchanges or, conversely, accumulating, withdrawing tokens from exchanges to their wallet👛. By clicking on any address, you will see all its coins and also the history of coin movements.
📸Photo marked 3. This is you going to the wallet you are interested in and clicking the visualise button, and you see who the wallet is connected to, from whom it receives coins and to whom it gives.
📸Photo marked 4. Next to visualise, there is a button trace, this is an extension of the visualize tool, if visualise shows you the connection of one wallet with others, then through trace you can build the entire transaction history and understand where the coins on this wallet came from and to which exchange they went.
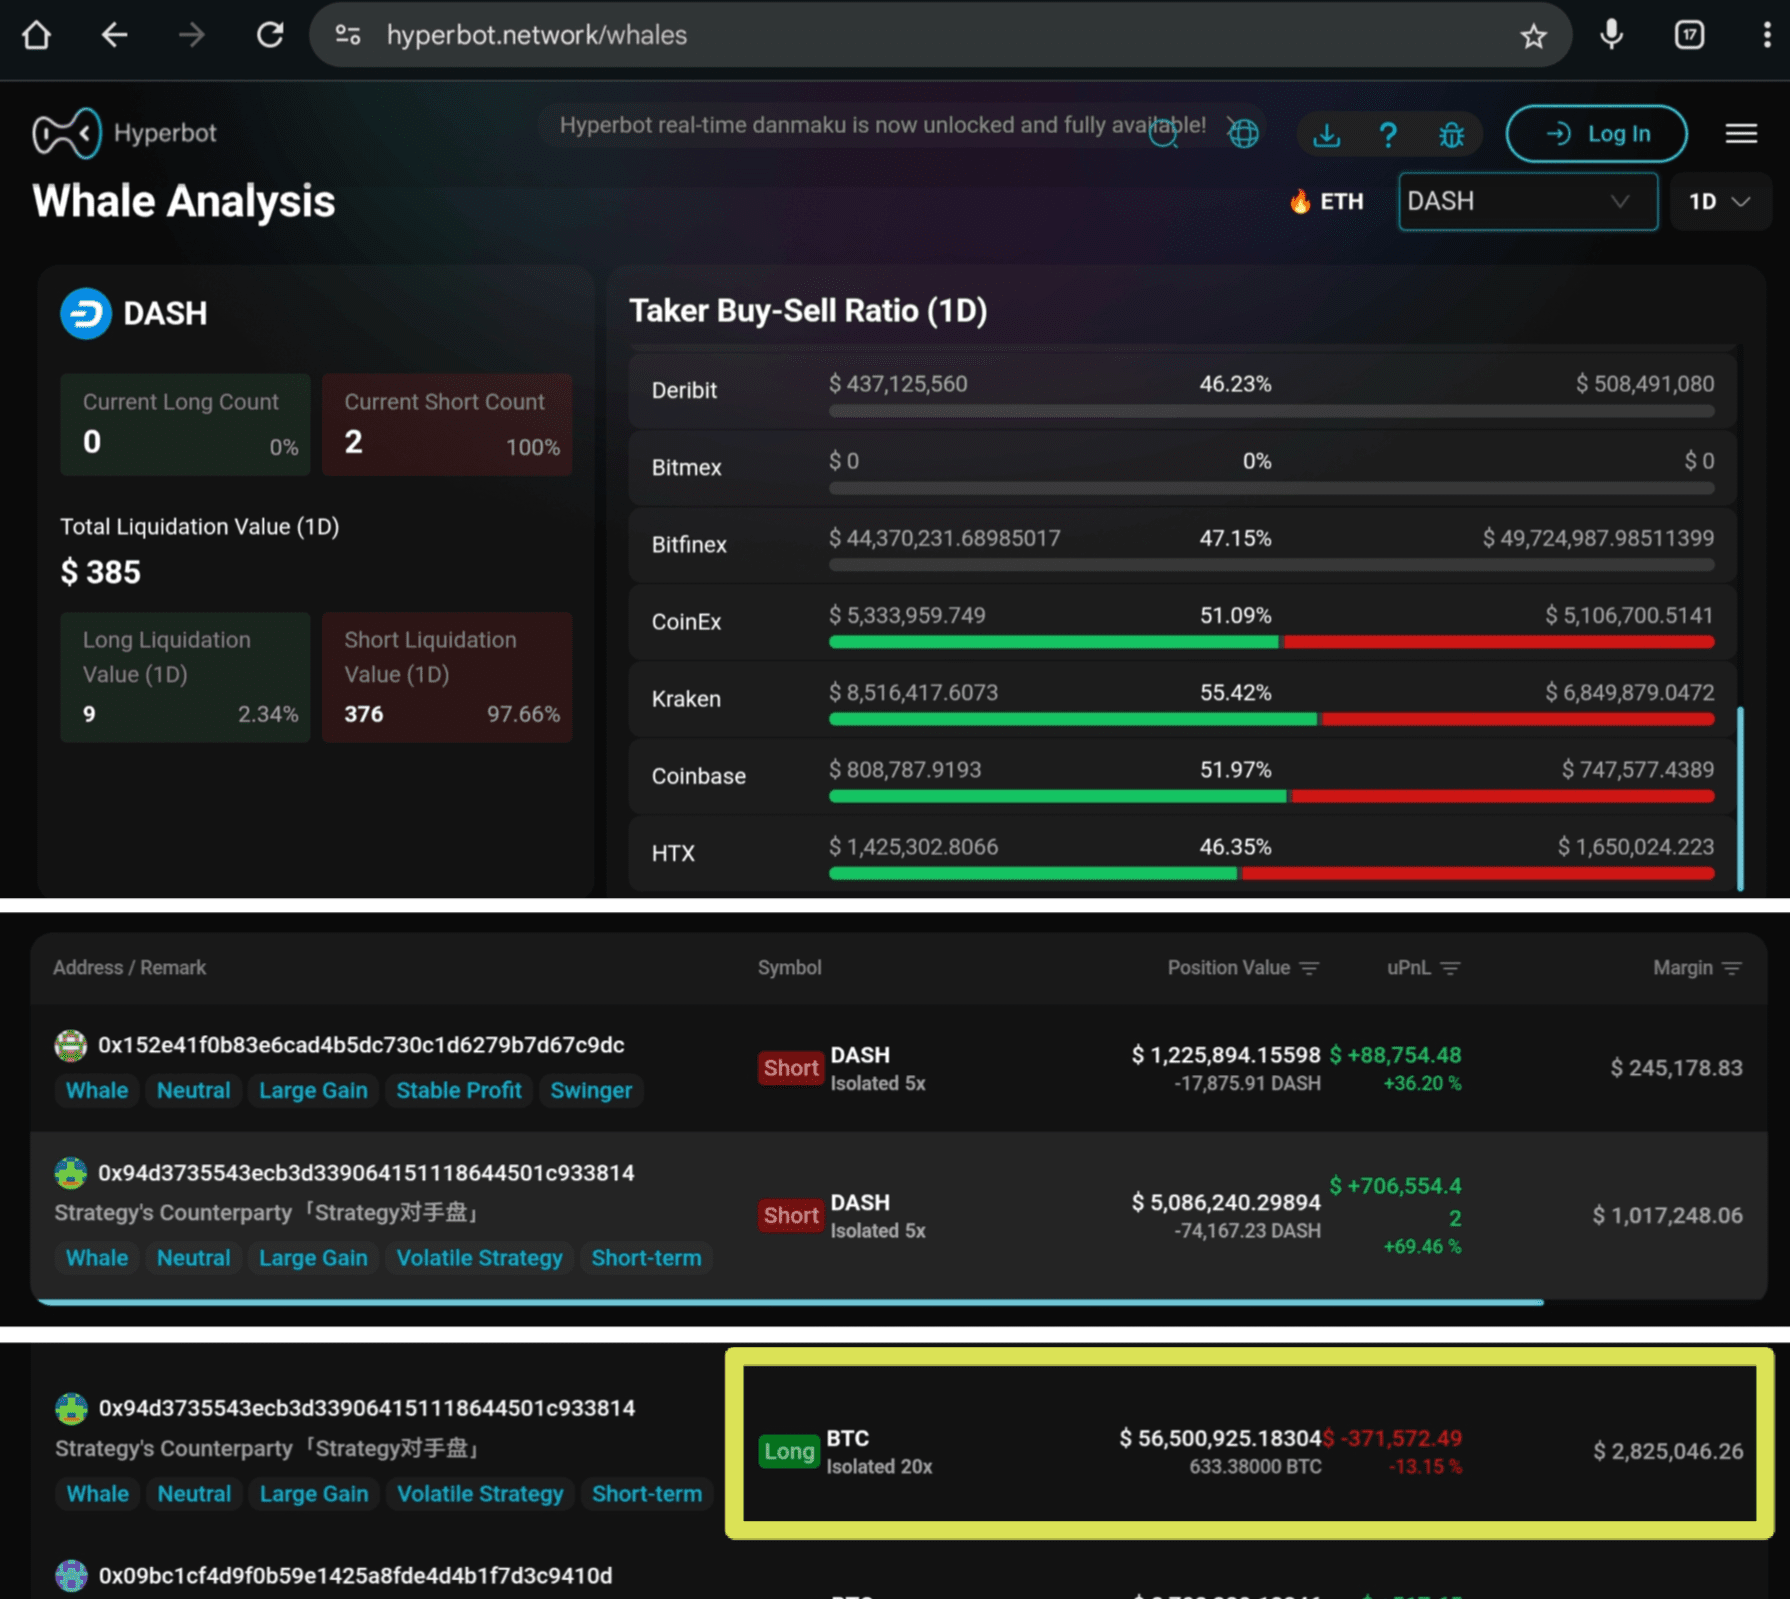
✅Tool 4. HyperBot service. This is where we will see where the whales are and what they are doing👀😱😱😱
There are not all coins from Binance, but most.
In the photo, an example $DASH , you see that two large shorts have been opened with a leverage of 5, totaling 6 million dollars. And also their profit💰
But it's a bit boring here, look below at the Long for BTC margin of almost 3 million dollars, leverage 20, position amount 56 million dollars, and current loss -371,572😔 But we believe in this person💪
✅Tool 5. Exchange order book🥤. I find it more convenient to look at the service stakan.io
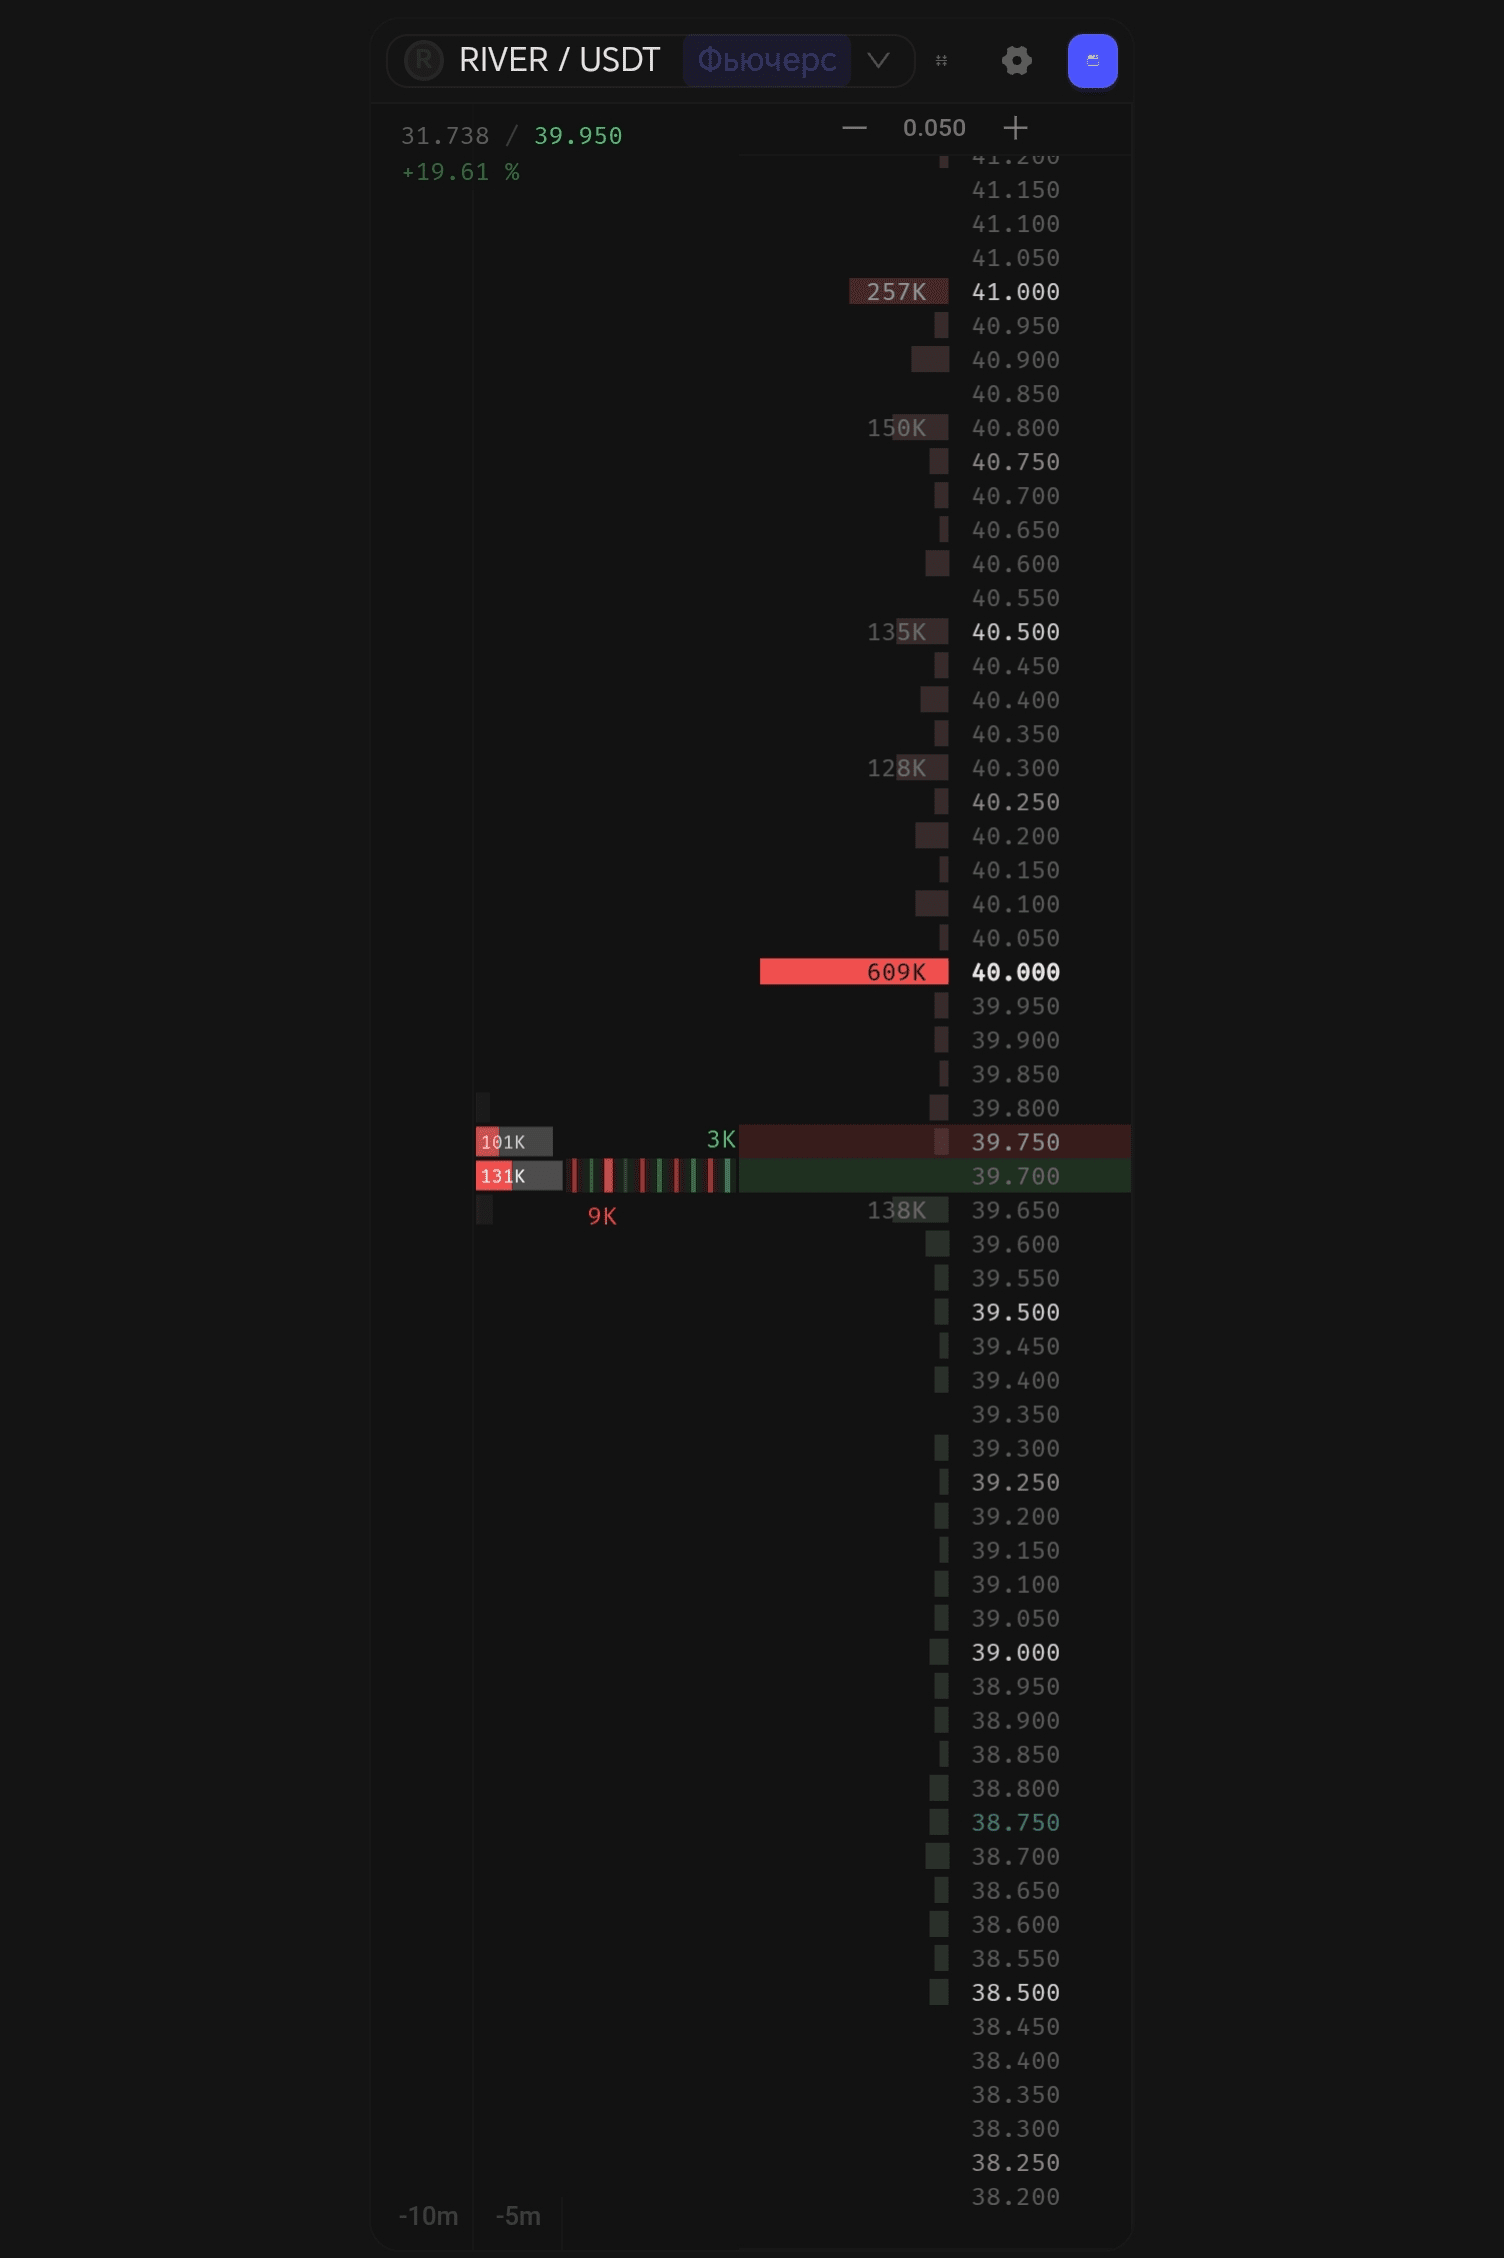 Actually, it is in the photo. I also wrote a separate topic about the order book🥤. Remember about iceberg orders and that where you see walls as in the photo at 609k does not guarantee you that the price won't go higher, it could be a spoof order💨💨💨.❗❗❗
Watch for 30 minutes👀 and you will see how it disappears and appears, and sometimes it appears already at a different price. This may just be bait🎣 for short positions: "Look, we definitely won't fly above 40.00, there are orders for 609k" and often when the price is 39.90, the order goes to 45.00😂
Be careful and use all tools🙂
If you didn't understand something, you can ask in the comments, or also express your opinion👇💬 And if you share what you use, it will bring even more benefits to others🙂
If you learned new information for yourself, then you know where to click so that others learn too🙂👍


#Write2Earn #BinanceSquare #analysis #BinanceSquareTalks #BinanceSquareFamily