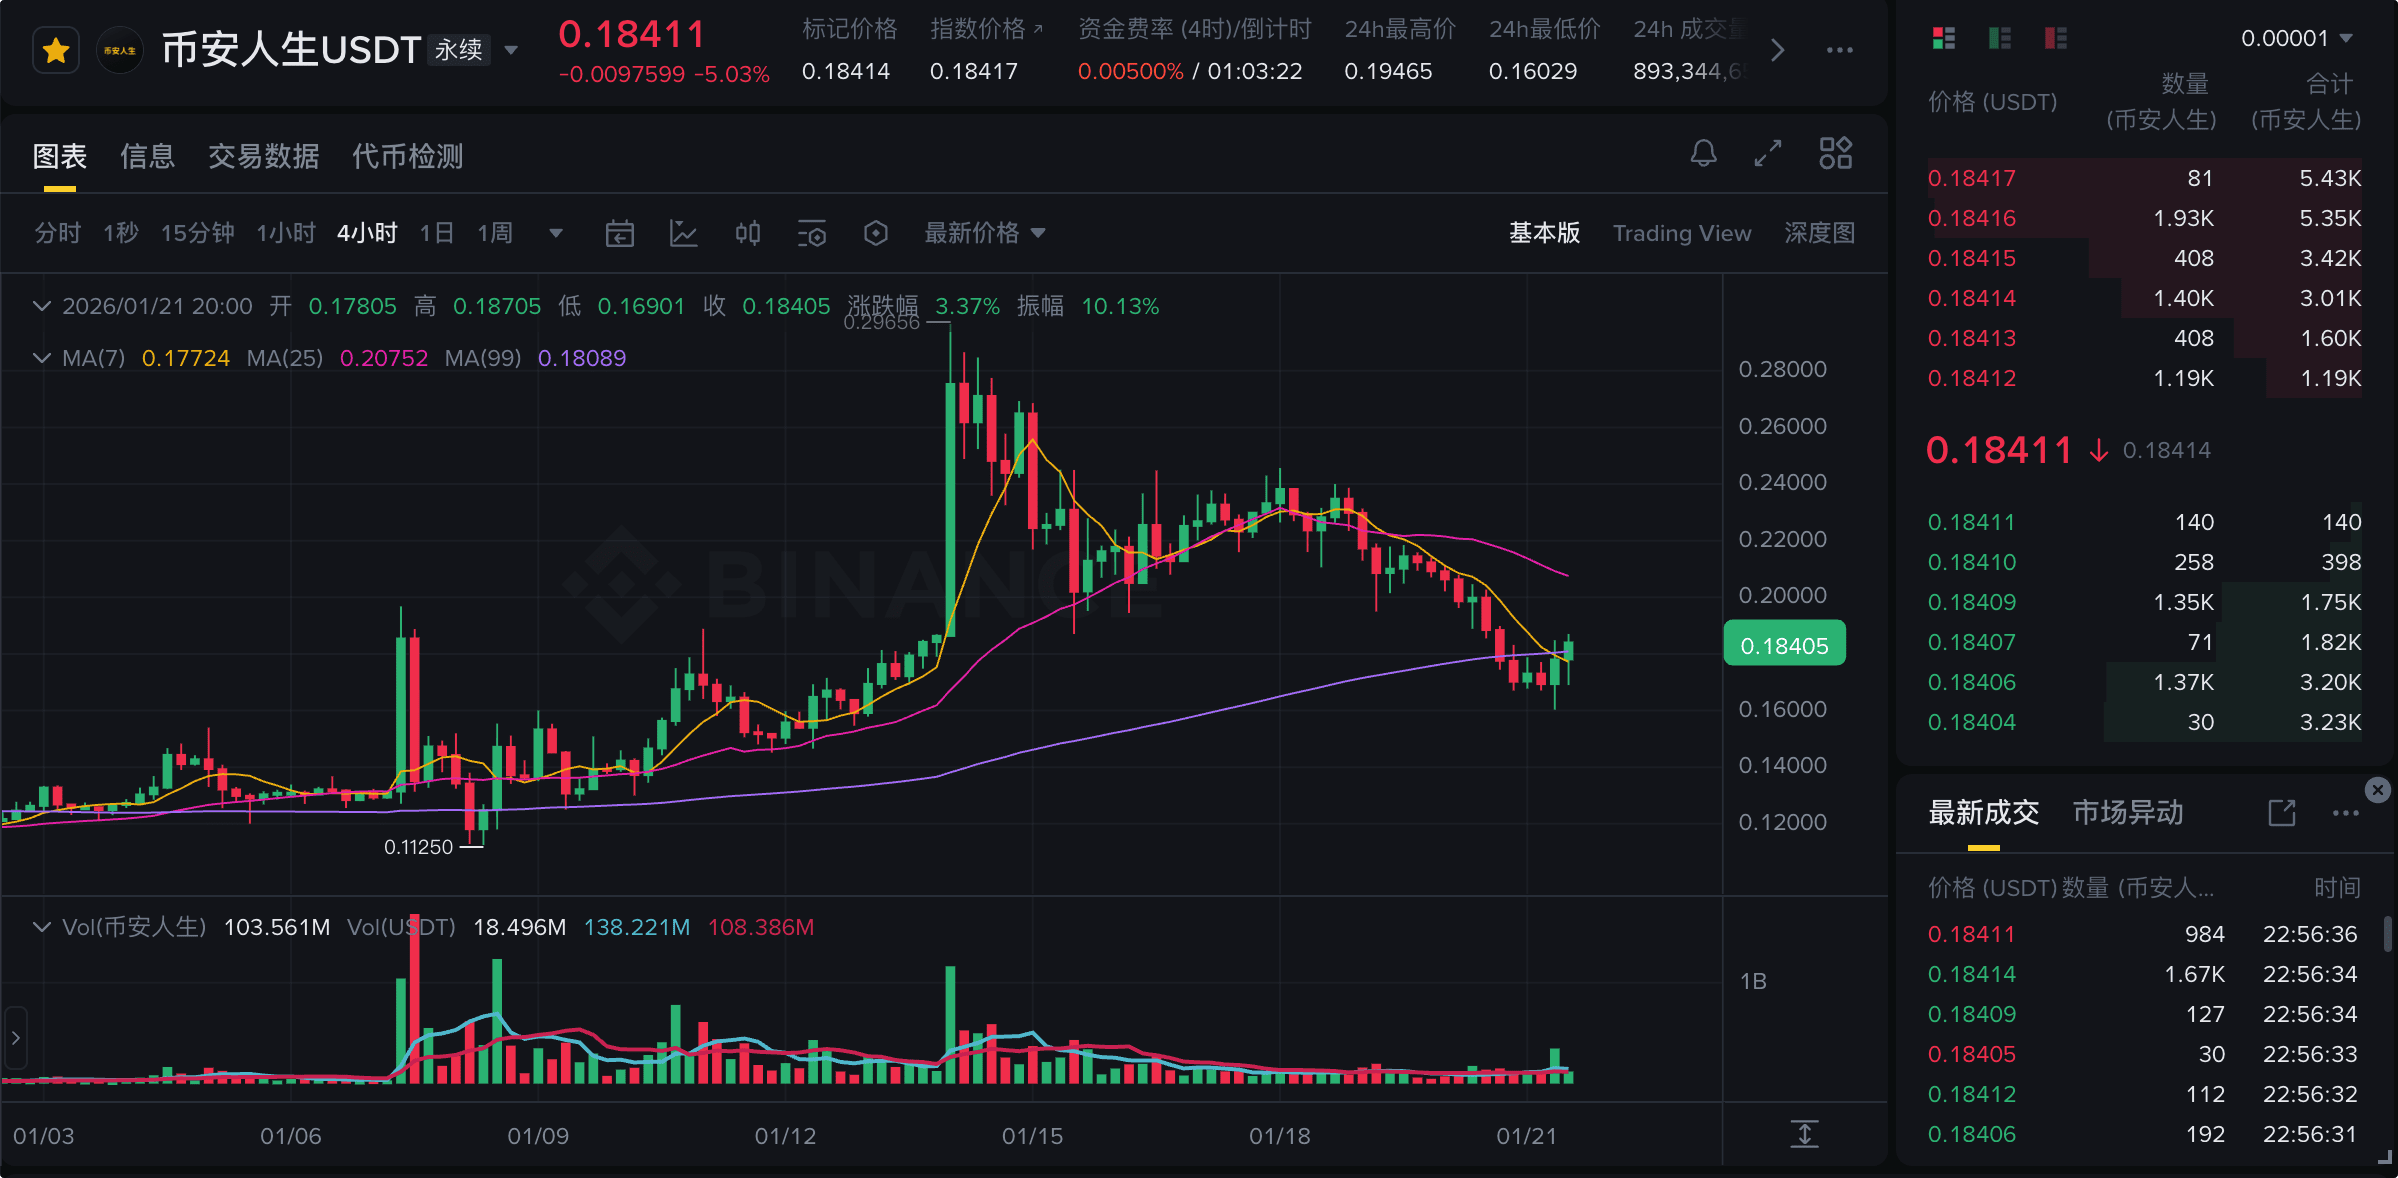
Currently, $币安人生 is in a 'critical game period after the emotional retreat'. From the current K-line chart, it has experienced a sharp parabolic rise, peaking around 0.296, and then quickly falling back to around 0.184.
Combining chart patterns with discussions from the crypto community (Social Media) about the BSC chain ecosystem, here is a detailed breakdown:
1. Core Driver: Narrative Logic and Market Sentiment
$币安人生 's fluctuations are not based on traditional fundamentals but are typically driven by 'narrative + flow':
'Binance Culture' Narrative (IP Premium): On social media, this token is often strongly linked to the history of Binance exchange, Zhao Changpeng (CZ), or He Yi's dynamics. The recent surge may stem from the community's expectations for the BSC ecosystem's revival or emotional resonance triggered by a specific event (such as Binance's anniversary, executive statements).
Post-PVP washout: Falling from 0.296 to 0.184 indicates that early profit-taking (Smart Money) has completed a round of selling. The current market is mainly composed of community 'diamond hands' and speculative funds attempting to profit from a 'second wave' rebound.
BSC capital flow back: In early 2026, market funds began to flow back from other public chains to BSC, and assets with a strong 'Binance' label became the preferred targets for capital absorption.
2. Technical analysis (key!)
The current trend is at a crossroads between 'air refueling' and 'gradual decline selling', with specific characteristics as follows:
Moving average pattern (top above, bottom below):
Resistance level (MA7): In the 4-hour chart, MA7 (yellow line) is at 0.20969. The price is currently running below MA7, indicating a weak short-term trend, with direct resistance forming near 0.21.
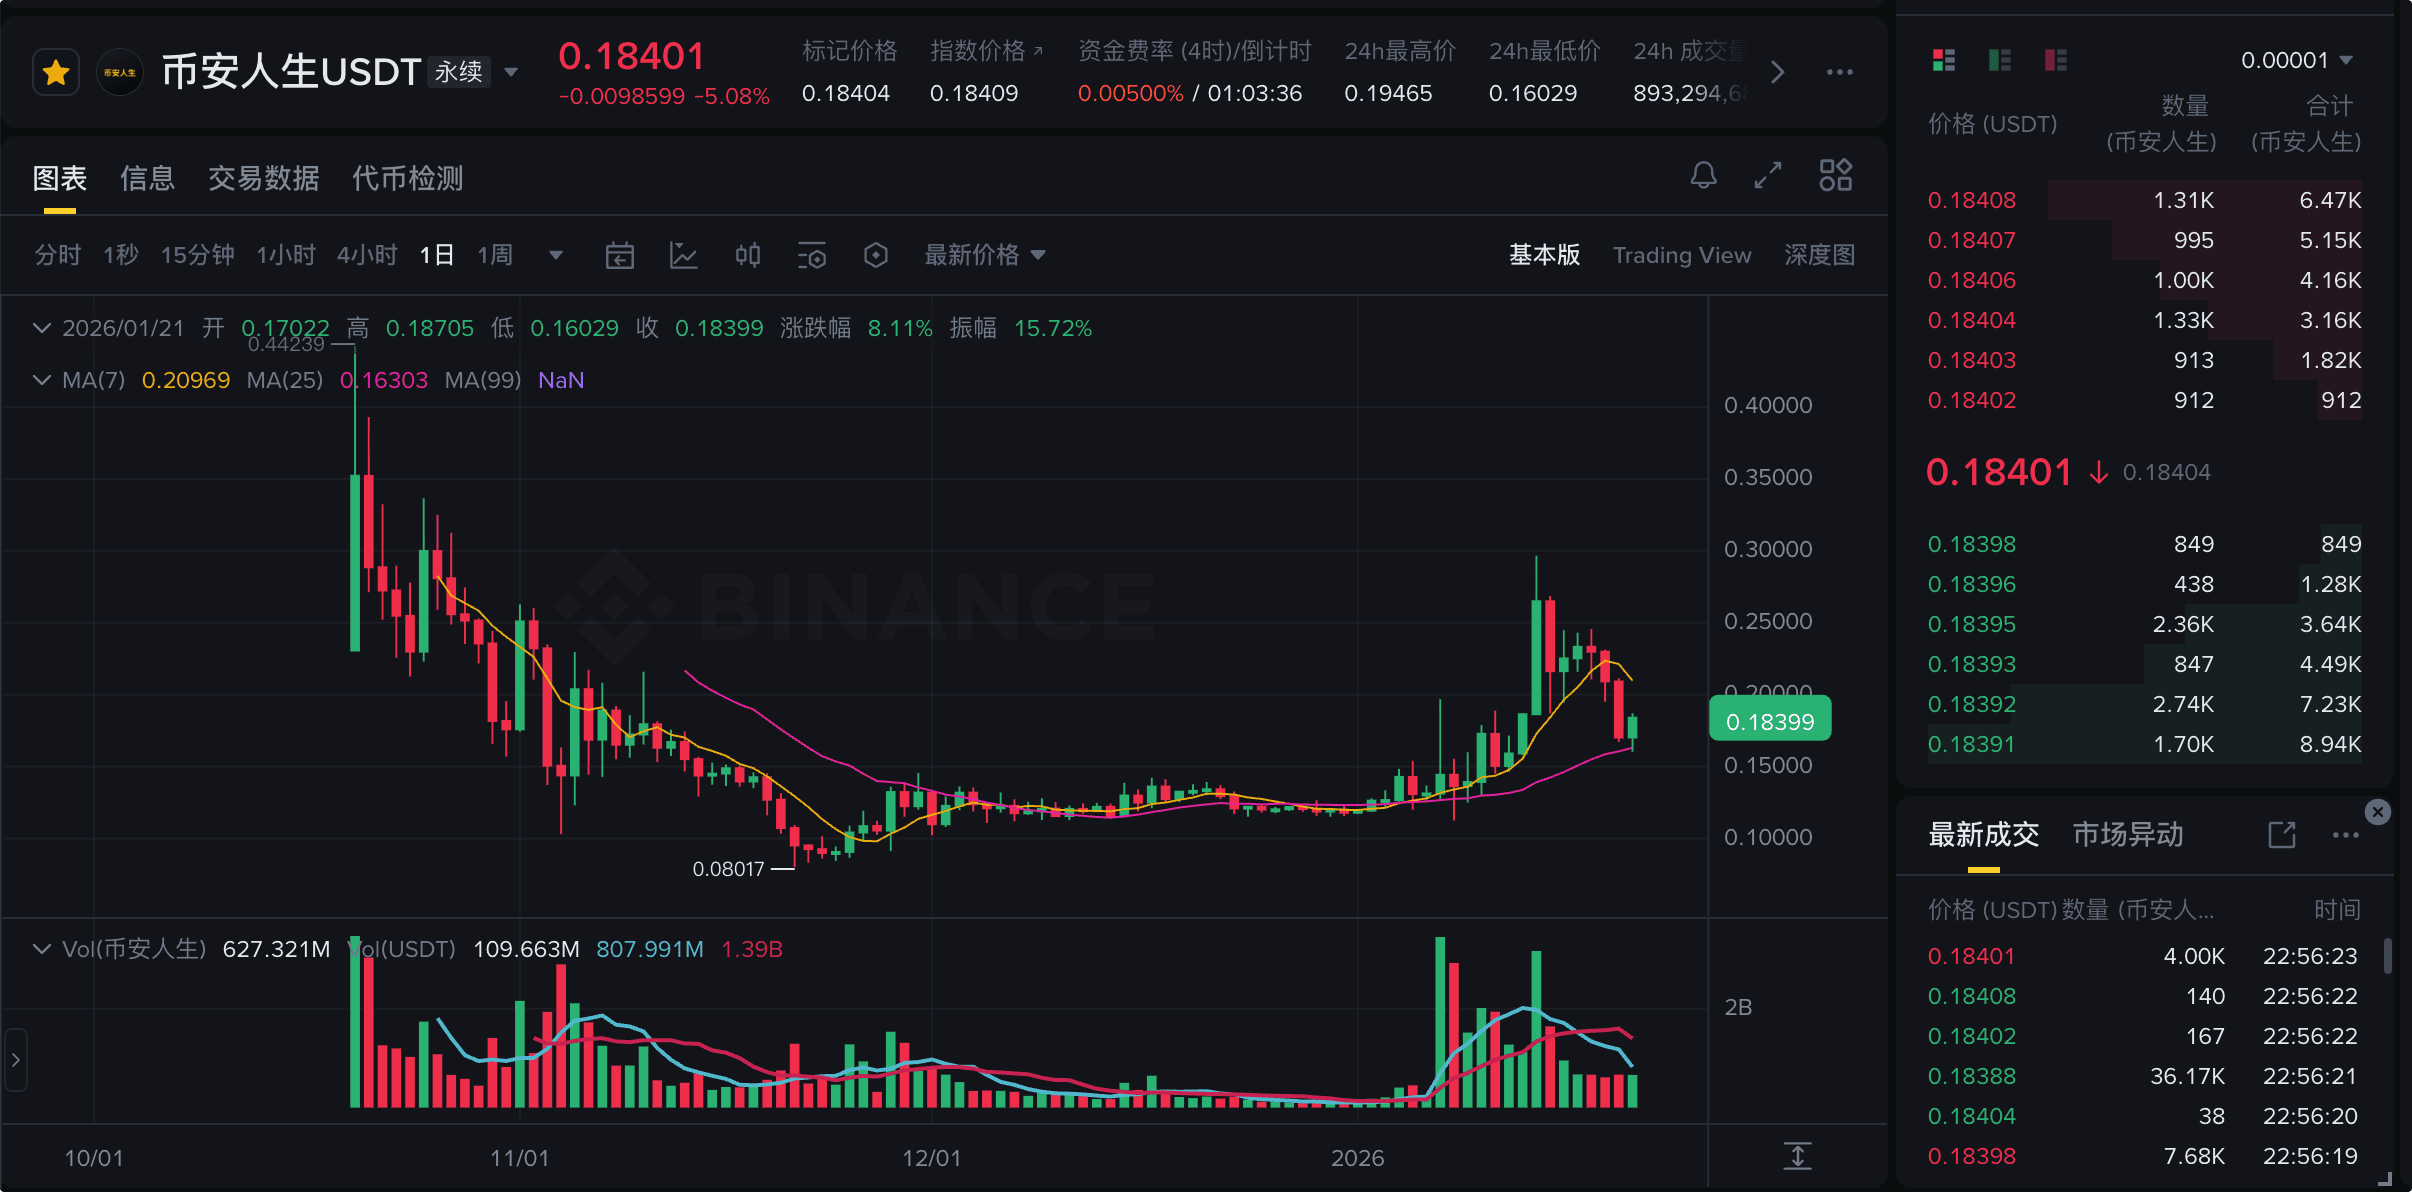
Support level (MA25): MA25 (pink line) is at 0.16303. This is the lifeline for the bulls. As long as the price does not effectively break below 0.163, the current drop is considered a healthy 'pullback confirmation' rather than a trend reversal.
Volume analysis (reduced volume pullback):
Observe the trading volume; as the price falls from the high point, the volume is gradually shrinking. This is usually a positive signal, indicating that panic selling is decreasing and positions are consolidating.
Candlestick patterns:
The 4-hour candlestick chart shows a very long upper shadow (High 0.296), which indicates heavy resistance above. In the daily chart, recent candlesticks are mostly small bearish and bullish, with high volatility (amplitude 15.72%), indicating significant divergence between bulls and bears, with no clear final direction yet.
3. Predictions for the next trend
Combining the high volatility characteristics of MEME tokens with current technical indicators, the trend script for the next 24-72 hours is as follows:
Script A: Building a bottom, secondary attack (probability 45%)
Phenomenon: The price stabilizes in the range of $0.165 - $0.175, no new lows. As the MA7 moving average gradually declines and flattens, the price breaks through MA7 (0.21) with a large bullish candle.
Logic: This trend means the 'washout' is over, and the main capital is re-entering to push up, with the target being to test the previous highs of 0.25 or even 0.29.
Trigger conditions: New positive news on social media is needed (such as interactions on Binance's official Twitter or monitoring large on-chain purchases).
Script B: Gradual decline, filling the gap (probability 55%)
Phenomenon: The price rebounds weakly, unable to stay above 0.20, and then slowly breaks below MA25 (0.163).
Risk: Once it breaks below 0.163 with increased volume, market confidence will collapse, and the price may directly seek the lower accumulation area, around $0.11 - $0.12 (previous starting point).
Logic: A typical MEME token 'A-top' pattern, where funds withdraw after the heat dissipates.
4. Operational recommendations
Given the extreme risk of contract operations, it is recommended to adopt the following defensive strategies:
Key level monitoring:
Long position defense: Focus on 0.163 (MA25). If the closing price on the 4-hour chart breaks below this level, decisively cut losses and do not hold positions.
Short position opportunity: If the price rebounds to 0.205 - 0.210 (near MA7) and shows a long upper shadow or significant volume stagnation, it is an excellent short point for the risk-reward ratio.
Don't rush to bottom-fish:
Currently, the RSI indicator has declined, but has not yet entered the extremely oversold zone. It is recommended to wait for right-side signals, that is, consider chasing long positions only after the price breaks and stabilizes above 0.195.
Pay attention to on-chain movements:
For this type of token, the candlestick chart is just a facade. Please pay close attention to the funding rate. If the rate is extremely negative, a 'short squeeze' may occur; if the rate remains high, bulls may struggle to maintain their positions.
Summary: $币安人生 during the period (1-2 days) faces a pullback repair demand, with 0.163 being the last defense for the bulls. Unless there is sudden positive news, a direct V-shaped reversal is unlikely, and it is highly probable that there will first be a consolidation in the range of 0.16 - 0.20 to consume the upper trapped positions.
Disclaimer: MEME tokens are highly volatile, and this article is only for technical analysis, not investment advice; please strictly control leverage.