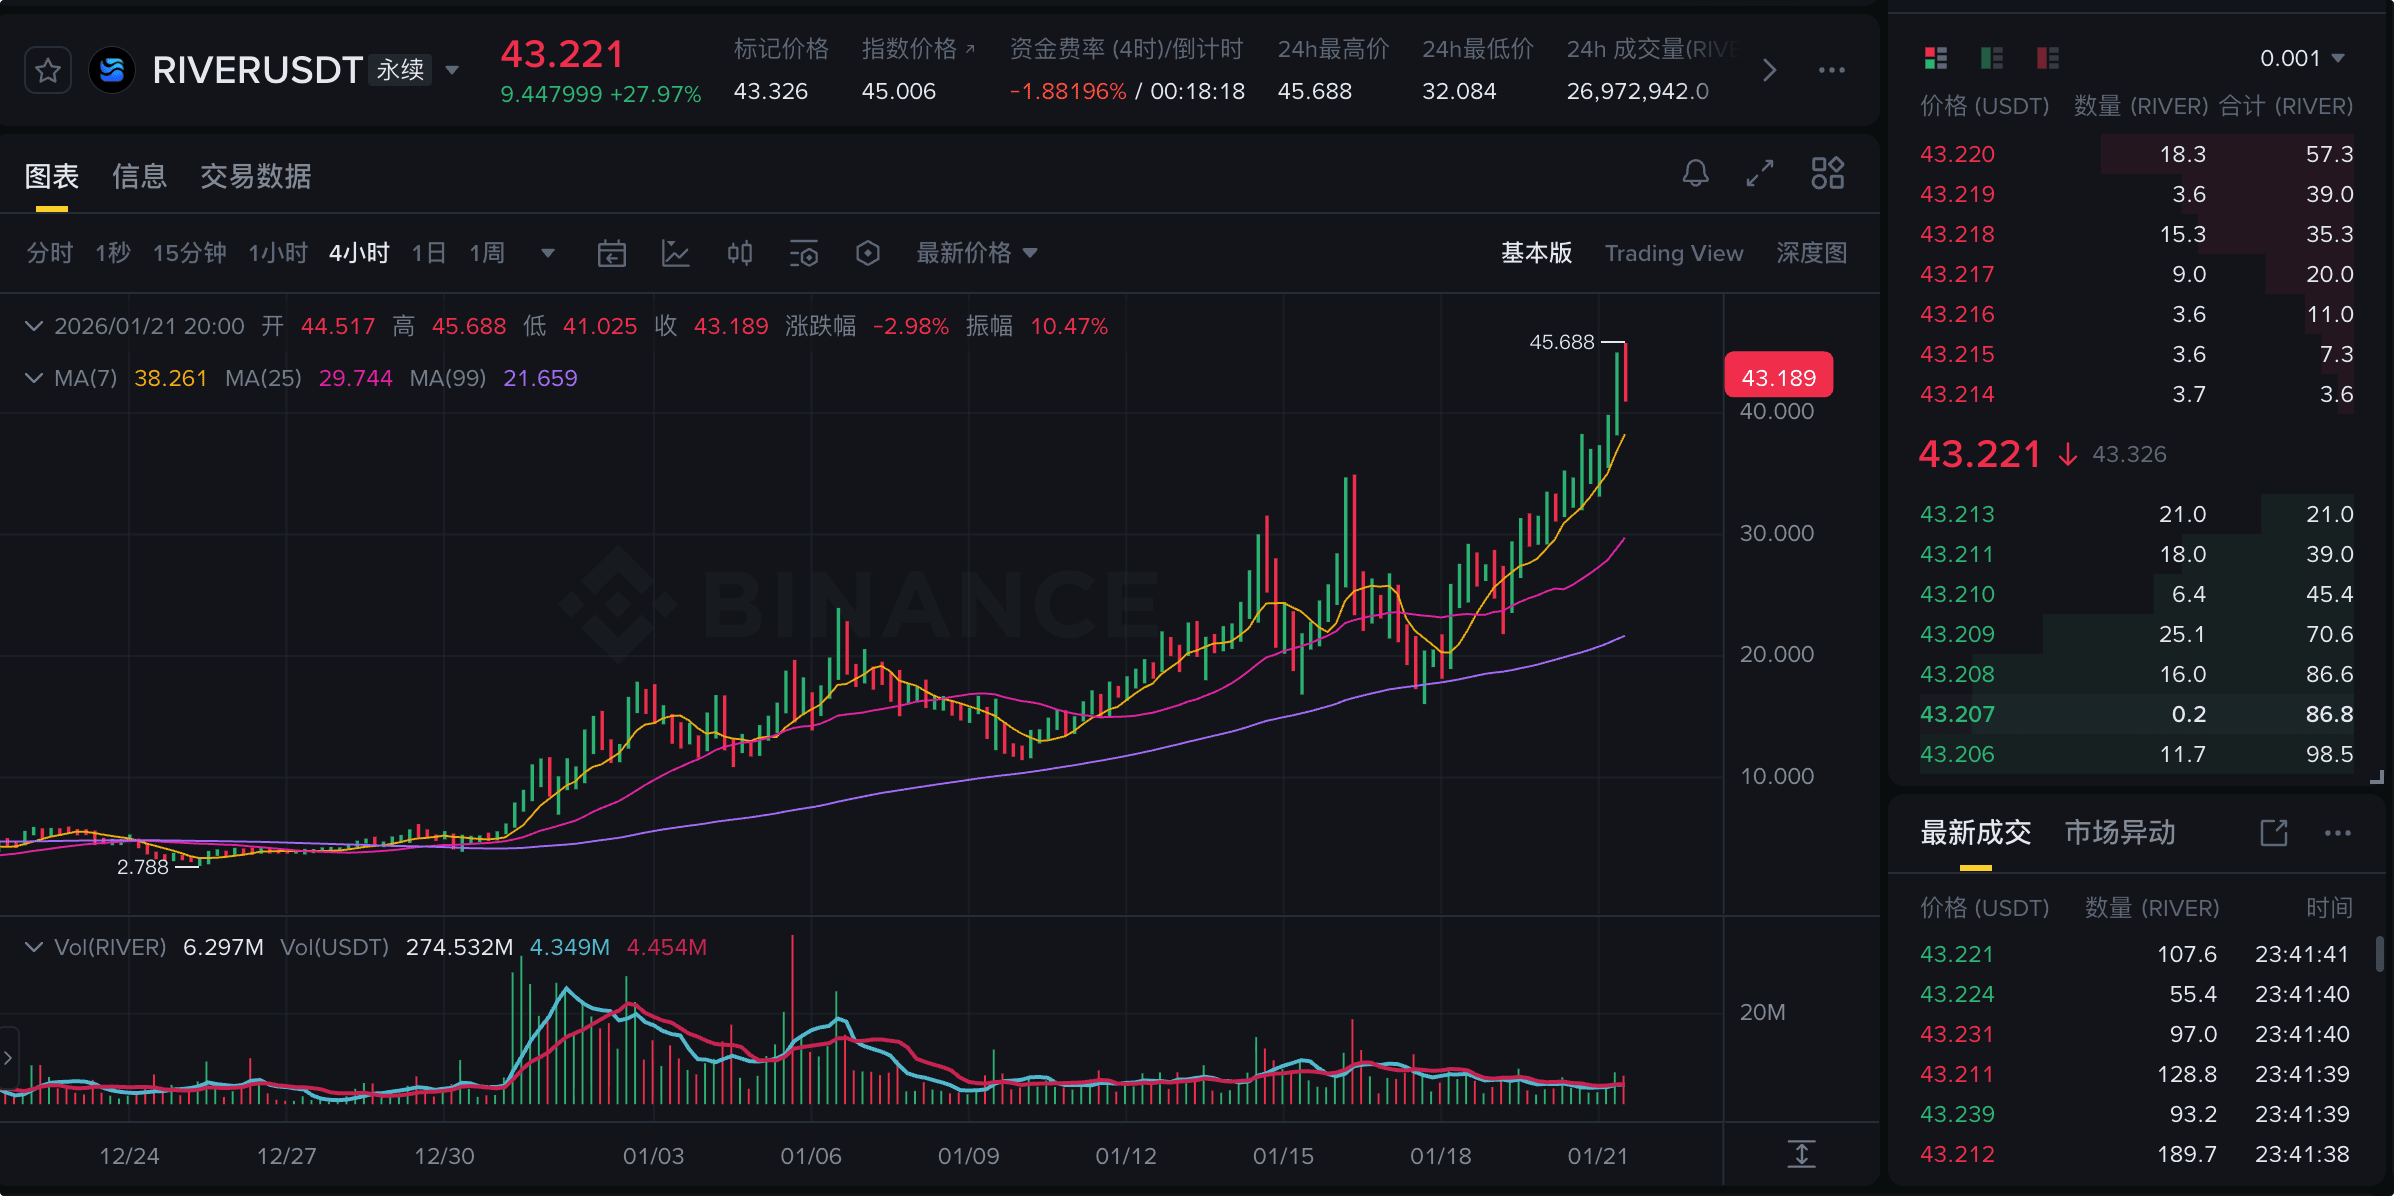
Currently $RIVER (River) is in a very critical "main uptrend acceleration + emotional FOMO" phase. Based on the current K-line volume and price chart and relevant news on social media, here is a detailed analysis of the trend:
1. Core driving force: The narrative game of long and short intertwining (news aspect)
$RIVE's current market complexity lies in the fact that it is facing both strong positive developments and imminent supply pressure, which has sparked intense long and short debates on social media:
Exchange liquidity premium (Coinone Listing): The hottest topic on social media and in the community currently is the listing of the KRW trading pair on January 20th by Coinone (a leading exchange in South Korea). This directly introduces expectations of a "kimchi premium" and new Asian buying funds. For $RIVE, a token with a narrative of "Chain Abstraction", entry into the Korean market is often seen as a catalyst for a liquidity explosion.
Upcoming supply shock (January 22 Unlock): This is also the sword of Damocles hanging over the bulls' heads. According to on-chain data, $RIVE will undergo a large-scale token unlock on January 22 (approximately 8% of circulating supply, valued at over 74 million dollars). The market shows obvious risk-averse sentiment, which is why the price rapidly retraced after hitting historical highs (ATH ~$45.69) — Smart Money is rushing to secure profits before the unlock.
Cross-chain stablecoin narrative (satUSD): Fundamentally, RIVE's 'Omni-CDP' model (allowing collateralization of assets on one chain to mint satUSD on another) is being repriced by the market. This liquidity solution, which does not require cross-chain bridges, is seen as a key infrastructure to address 'liquidity fragmentation' in 2026, providing long-term value support.
2. Technical analysis
The current candlestick trend displays textbook-level 'Parabolic Run' characteristics, with bullish power being absolutely dominant, but risks are also accumulating rapidly:
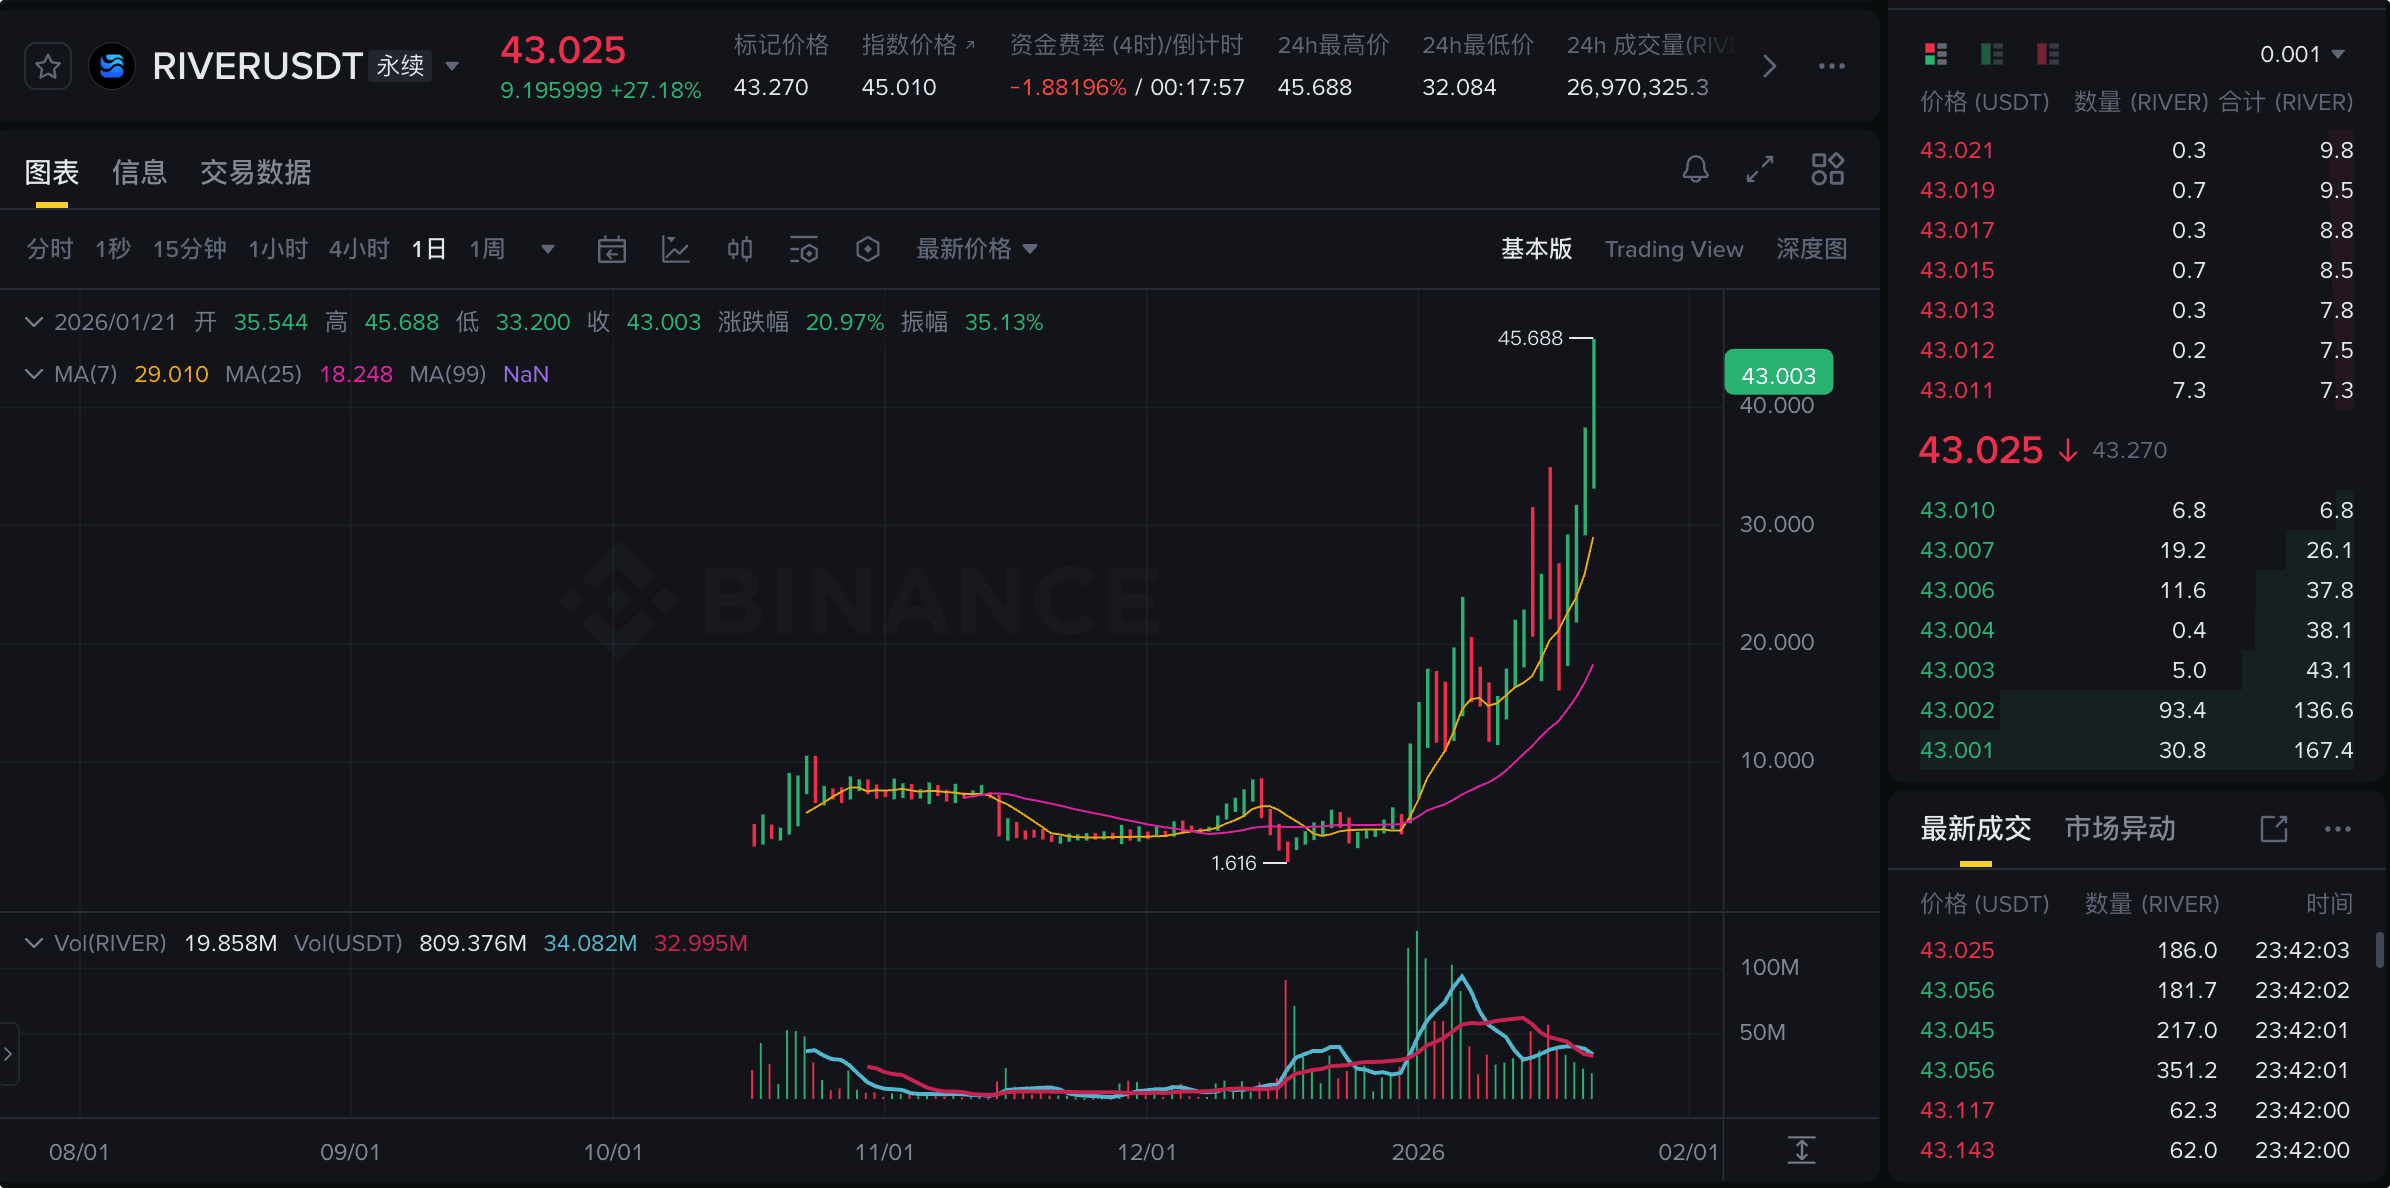
Volume and price structure (extremely strong but needs caution):
Daily level: Starting from near the bottom of 1.616, the price has increased over 20 times and has shown nearly a 90-degree vertical rise recently. This trend indicates extremely strong buying pressure, but also suggests it is in a stage of 'irrational exuberance.'
4-hour level (4H): The most recent candlestick showed a long upper shadow (peaking at 45.688), followed by a bearish candle. This indicates that there are some profit-taking at the level above 45 dollars, and divergence between bulls and bears is beginning to emerge.
Moving average divergence (high-risk signal):
Daily divergence: The price (43.003) is far detached from the daily MA7 (29.010) and MA25 (18.248). This enormous divergence historically tends to be unsustainable, with a strong 'gravitational' demand for the price to either trade sideways until the moving averages catch up or drop sharply for a pullback.
4H divergence: Even the short-term 4H MA7 (38.261) is currently about 12% away from the current price. This indicates significant space for a short-term pullback.
Morphology: Currently at the end of the 'flagpole.' 45.688 constitutes a short-term ATH (all-time high) resistance level. The support levels below appear quite empty due to the rapid rise, lacking a dense area of chip exchanges.
3. Next trend forecast
With the continuous heat of news and the serious overbought nature of the technicals, the next trend is likely to evolve into one of the following two scenarios:
Scenario A: High-level spike washout (probability 65%)
Phenomenon: After the price attempted to break 45.688 and failed, a rapid 'door painting' or significant spike and pullback occurred.
Logic: Early profit-taking (whales who bought at lower prices) need liquidity to offload, and high funding rates will force longs to close positions.
Target level: The first target level for the pullback is 4H MA7 (approximately 38.0 - 39.0 range). If panic intensifies, it may spike through this level to test 35.0 near the integer threshold, completing the leverage cleanup.
Scenario B: New highs after aerial refueling (probability 35%)
Phenomenon: The price is experiencing narrow fluctuations at high levels in the 40.0 - 43.0 range, rejecting deep pullbacks.
Logic: Off-market funds are extremely thirsty, and any slight pullback is supported by buying. After 1-2 days of sideways movement, let the 4H MA7 moving average catch up, then initiate a second wave of upward movement, targeting the key level of 50 dollars.
4. Operational suggestions
Based on the current extreme situation, it is recommended to adopt strict risk control strategies:
Avoid Top-Chasing: The current position (43+) has a very poor risk-reward ratio. The RSI indicator is severely overbought on both daily and 4-hour levels, and buying with a full position is akin to dancing on a 'volcano's edge.'
Focus on key pullback levels (Buy the Dip):
Observation point: Closely monitor 38.26 (4H MA7) this line. If the price drops sharply to this level and shows a significant lower shadow rebound, it is the best time to enter long positions.
Right-side trading: If the price can effectively break through 45.7 and hold above for over 1 hour, then the upper space opens up, allowing for light position chasing, targeting above 50.
Taking Profit strategy: For investors holding bottom chips, this is an excellent window for partial profit-taking. It is recommended to realize part of the capital in the 43-45 range while retaining profit positions to speculate on the subsequent 'crazy wave.'
Contract risk control: The current volatility (IV) is extremely high, and it is advised to significantly reduce leverage multiples. A 10% fluctuation within the day will be common, and high leverage is prone to double liquidation.
Summary: $RIVER Currently, we are in the craziest stage of the main upward wave, facing the pressure of repairing the divergence rate in the short term (looking towards the 38-39 range). In the medium to long term, as long as it does not break below the daily MA7 (29.0), the upward trend remains intact, but caution is needed for a liquidity crisis after a retreat in sentiment.
Disclaimer: The crypto market is highly volatile and risky, and this analysis is for reference only and does not constitute investment advice.
