Format: system operation display (not a signal)
0) Summary by the numbers
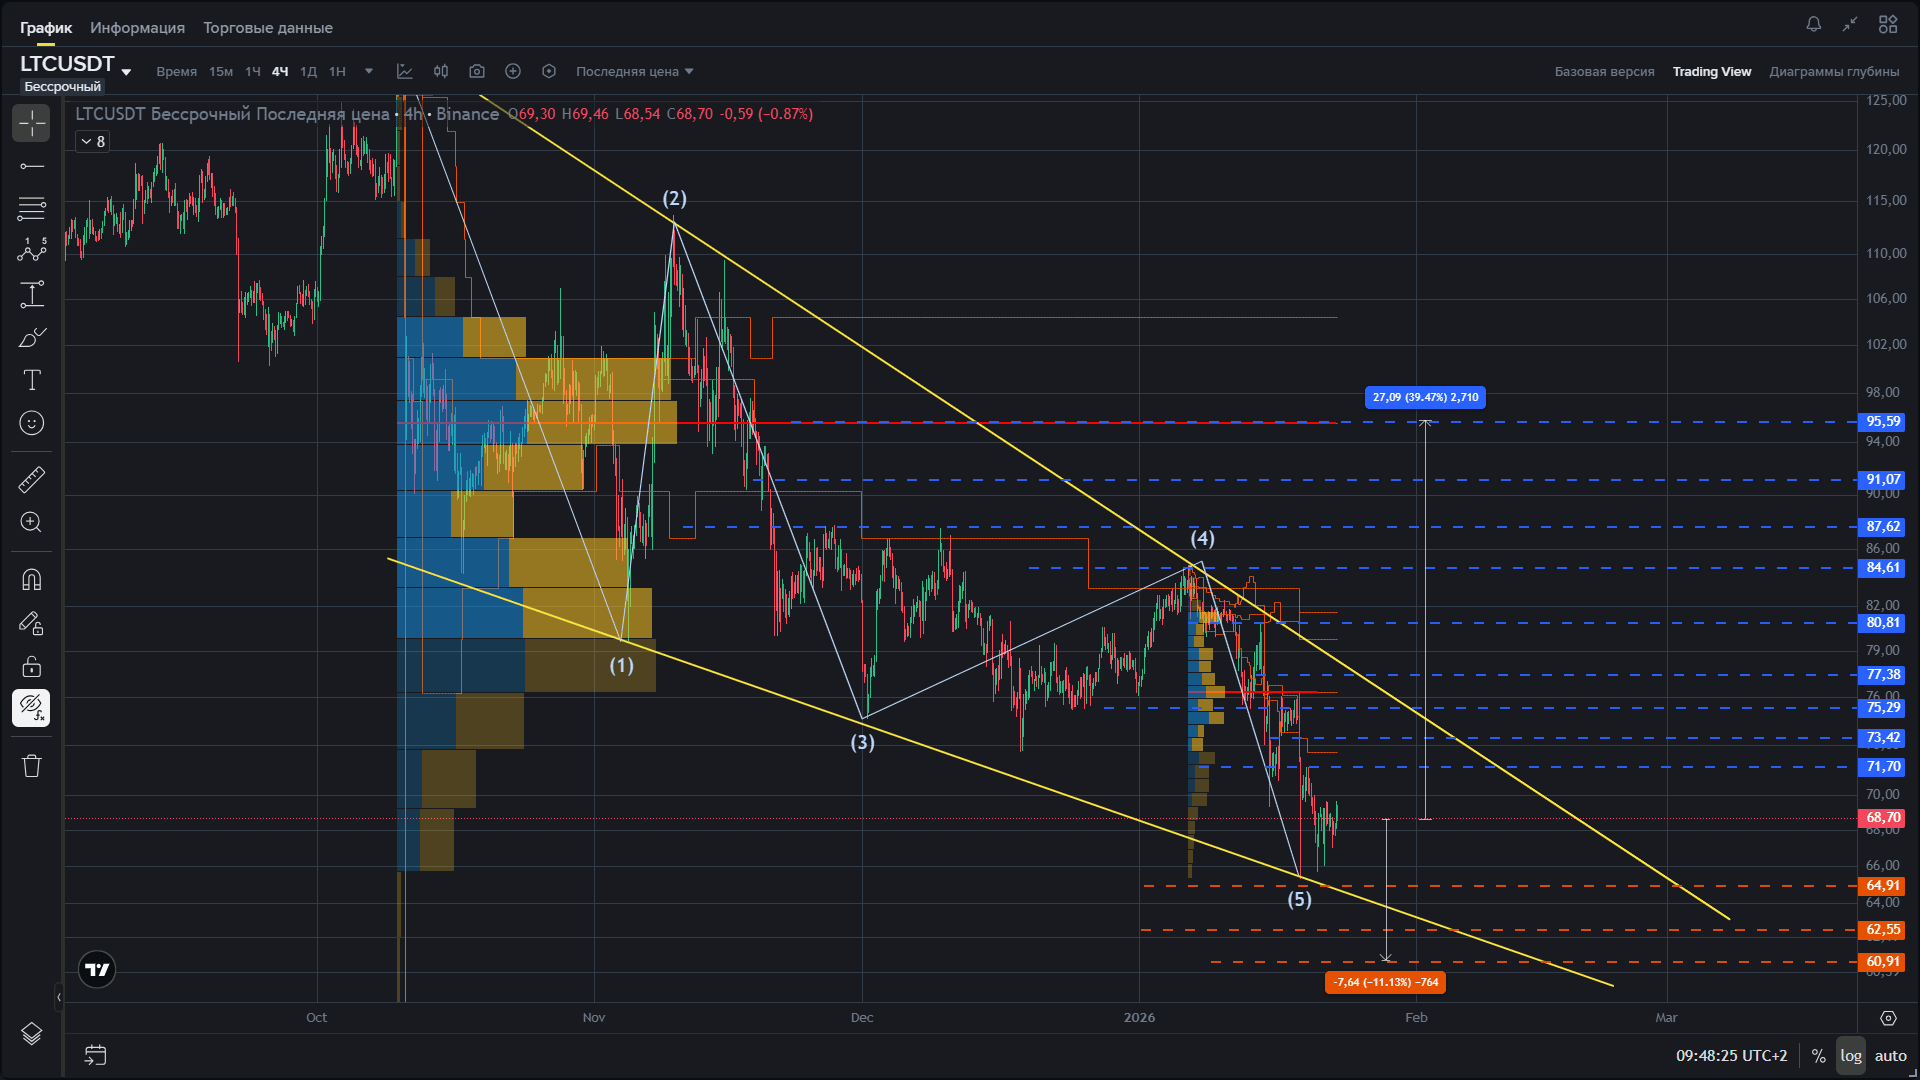
Price: 68.65–68.70
Market Cap: 5.27B
24h Volume: 346.16M
24h Change: +0.65%
1) System input data (what it reads)
RSI (table)
15m: 43.3 — no momentum
1h: 50.6 — neutral
4h: 43.3 — weakness
24h: 34.3 — oversold
7d: 35.4 — weak trend
MACD normalized (table)
15m: -0.13 — weak minus
1h: +0.08 — almost zero
4h: +0.35 — there is a bounce
24h: -1.27 — bearish structure
7d: -3.00 — systemic weakness
4H structure (chart)
Price in a descending wedge, bounce from the lower boundary
EMA: 7d 68.60, 21d 69.21, 50d 71.44, 100d 74.08, 200d 76.81 → above is the 'ceiling'
BB: mid 70.02 / low 67.21
SAR: 71.76 above
Ichimoku: 68.55 / 72.76
Money flows
FUTURES:
5m +5.99K, 15m +88.44K
1h -919.09K, 2h -1.64M, 4h -3.23M, 6h -3.50M, 8h -2.16M
1D -8.80M, 7D -130.08M, 30D -347.69M
Output: derivatives are flowing out → the market does not provide 'long comfort'.
SPOT:
5m -2.78K, 15m +5.91K
1h -37.35K, 2h -266.85K
4h +91.12K, 6h +942, 8h +364.13K, 1D +268.24K
7D -7.55M, 30D -97.83M
Output: there is an inflow within the day, but week/month — minus.
Liquidity
Main clusters above 70–71+
Output: the price is often pulled there, but this is not a 'mandatory target', but a risk zone.
2) Price forecast (as a result of filtering)
Short-term (24–72h)
For growth: bounce from the bottom of the wedge + MACD(4h) in the positive
Against growth: MACD(24h/7d) is bearish + futures are flowing out
Attraction zone above: 69.2 → 71.4/71.8 → 73.4
If they push back → quick return to 67.2 and below.
Medium-term (1–3 weeks)
As long as the price is below EMA21/50/100/200 and SAR above → medium-term bearish/corrective.
Key: consolidation above 71.7–73.4.
Without this growth = bounce within a descending structure.
3) Levels (support/resistance)
Supports:
68.55–68.60
67.21
64.91
62.55
60.91
Resistances:
69.21
70.02
71.44
71.70–71.76
72.76
73.42 / 75.29 / 77.38 / 80.81 / 84.61 / 87.62 / 91.07 / 95.59
The nearest 'working ceiling': 69.2–71.8.
4) LONG plan (structure options, not a signal)
Long A — aggressive (bounce)
Entry zone: 68.6–67.2 (as long as the wedge/BB low holds)
Stop: below 64.91 (break of the bounce idea)
Take profits: 69.21 → 70.02 → 71.44–71.76 → 73.42
Risk: trend older than 4H against (MACD 24h/7d minus + futures are flowing out)
Long B — conservative (confirmation)
Condition: stay above 69.21 and hold
Entry: retest 69.2–69.3 from above
Stop: below 68.55–68.60
Take profits: 70.0 → 71.4/71.8 → 73.4
5) SHORT plan (structure options, not a signal)
Short A — from resistances
Entry: 71.4–72.8 (EMA50/SAR/Ichimoku top)
Stop: above 73.42
Take profits: 70.02 → 69.21 → 67.21 → 64.91
Short B — on the breakout of support
Condition: breakout and hold below 67.21
Entry: retest 67.2 from below
Stop: above 68.6–68.7
Take profits: 64.91 → 62.55 → 60.91
6) Leverage (not 'how much is needed', but how much can withstand the risk)
Fact: higher TFs are bearish + futures are flowing out → low leverage.
For 'bounce/wedge' (stop far) → 1–3x
For 'confirmation/retest' (shorter stop) → up to 3–5x
Above → this is already a bet on luck and noise.
7) Scenarios and probability
Growth to 70–71.8: ~45%
Failure of the bounce to 64.9 / 62.6: ~35%
Sideways 67–70: ~20%
Why is ChatGPT here
It does not 'predict'.
It runs the market through filters and shows where the risk is higher than the benefit.
I show the system's operation publicly.
Only facts, structure, and risk control.
➡️ training the trading system using ChatGPT
#ОбучениеТрейдингу 'ChatGPT trading system' #CryptoTrading
#RiskManagement ⚡ Strategies — how to move and where to enter—@INVESTIDEAUA