There’s a lot of noise in the market right now. Rumors, bold predictions, and emotional takes from both bulls and bears. The problem is that most people only look at one side of the market. Whether you’re buying or selling shouldn’t change how you read the chart. A careless prediction can affect real people and real money.
So I don’t move on opinions. I do the work first.
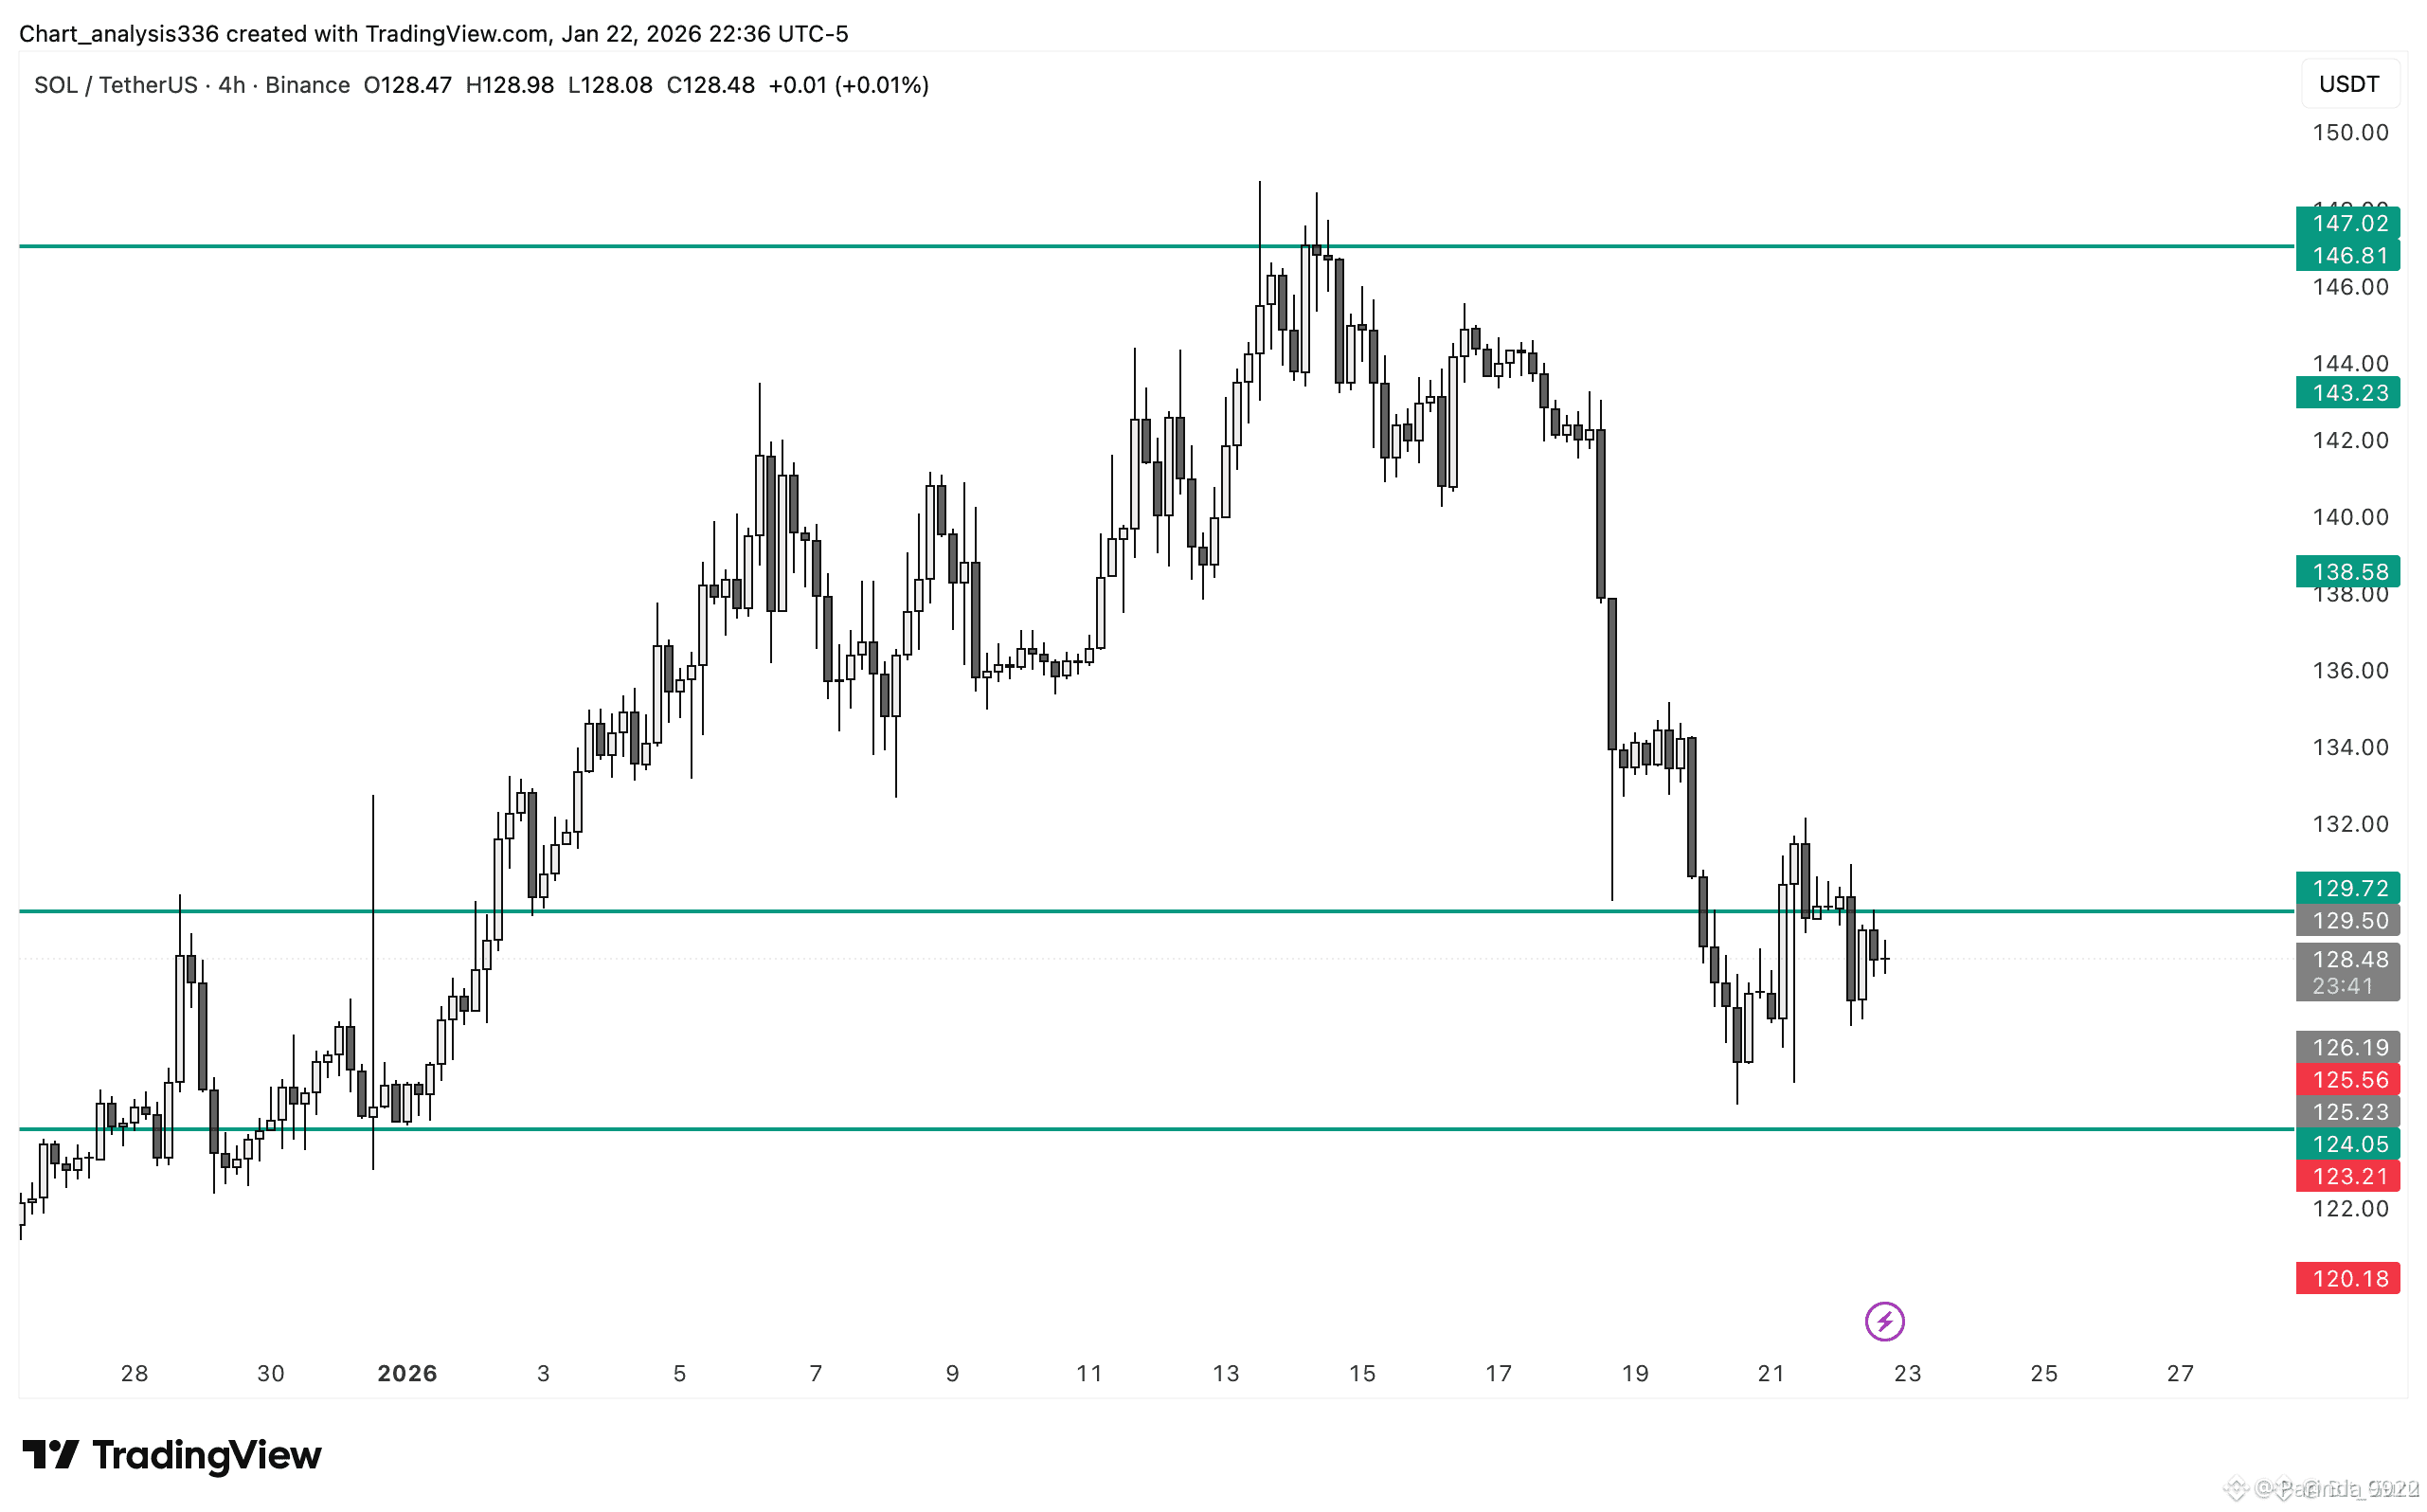
Looking at the SOL chart, the structure is clear. Price dumped from the $145–$147 resistance zone down to around $123 after a strong bullish move. That kind of pullback isn’t unusual.
People celebrate when they win. I learn when I lose.
Lessons are everywhere if you’re willing to see them.
From experience, SOL still looks positioned for a larger bullish move. But only for those who can hold.
Right now, SOL is reacting around a key demand zone between $125–$130. This area previously acted as a solid base before the last expansion. After the sharp sell-off, selling pressure has slowed. Price is no longer printing aggressive lower lows, which usually tells us panic selling is fading and the market is deciding its next move.
As long as $124–$125 holds, this looks like a corrective pullback, not a trend reversal. Consolidation above this zone increases the chances of a relief bounce toward $138–$143, where previous structure and supply exist. If buyers step in and form higher lows, that would confirm short-term recovery strength.
On the downside, if SOL loses $124 with strong volume, price could move toward $120–$118, the next major support area. That zone should attract buyers again, but momentum would remain weak unless SOL reclaims $130–$132 convincingly.
If this base holds, SOL has room to rebuild momentum and challenge the $150–$160 resistance zone in the medium term. Acceptance above that area would confirm trend continuation and shift the structure back into expansion mode. From there, upside targets open toward $180 and then the $210–$230 range, which aligns with prior liquidity and long-term extension levels from the previous impulse.
A move to $210–$230 won’t happen overnight. It would come through a series of higher highs and higher lows over weeks or months. This outlook stays valid as long as $120–$125 acts as strong support. A decisive weekly close below $120 would delay this scenario and point to a longer consolidation phase instead.
Overall, the $120–$130 zone looks more like opportunity than weakness within the broader trend.
From the chart, this appears to be a major local bottom and a key support area for now. Long-term investing matters here. If you’re thinking clearly, a 2–3 year horizon gives you the best edge.
This zone offers strong risk-to-reward for long positions. Patience is the real strategy.
If you have questions, drop them below. I’m happy to answer.