You see, the market is going up — higher highs, higher lows, the price is pulling upwards. This is a classic uptrend. If it lasts for weeks, it is also called a bearish/bullish long-term trend, and if for hours — a short-term impulse.
You enter the long, as if everything is under control… but then the candles start making strange movements: pullbacks become deeper, volumes fall. You feel: 'oh, something is wrong.' And here the trend begins to break — this is a trend change when demand and supply equalize or selling increases.
Especially cool when you just picked up coffee at work, looking at the chart between calls, and suddenly see your long flying in the opposite direction. Here you understand: the market doesn't care about your plans.
To understand the trend, you don't need to guess on coffee grounds: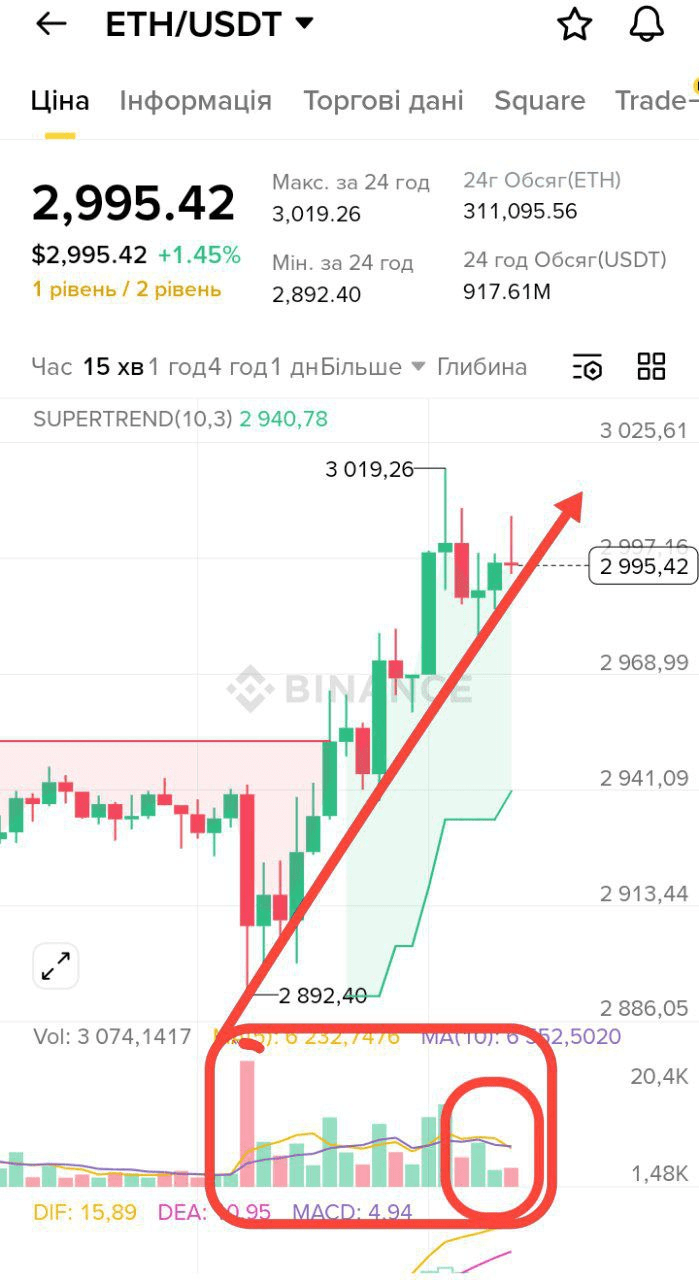
Higher highs and lows → uptrend.
Lower highs and lows → downtrend.
Flat chart with small movements → sideways trend.
My little trick: watch the volume and impulses. If the price goes up and the volumes decrease — the trend weakens. And then you are no longer afraid to exit, but understand that "it has died," and your stops are not a defeat, but planned work.
Trading by trend is not about "guessing where the market will go," it is about reading signals and going with it, like on a wave.
And do you more often:
you manage to see the trend change and exit,
or do you hold until the last candle while the coffee has already cooled down?#trend #bdlyaw $ETH
