🦅 Flying Fish Afternoon Analysis: Weekend decline and retest, 88,600 support line is at risk!

Latest situation review (in-depth interpretation based on charts): Click to join the Flying Fish Strategy Chat Room

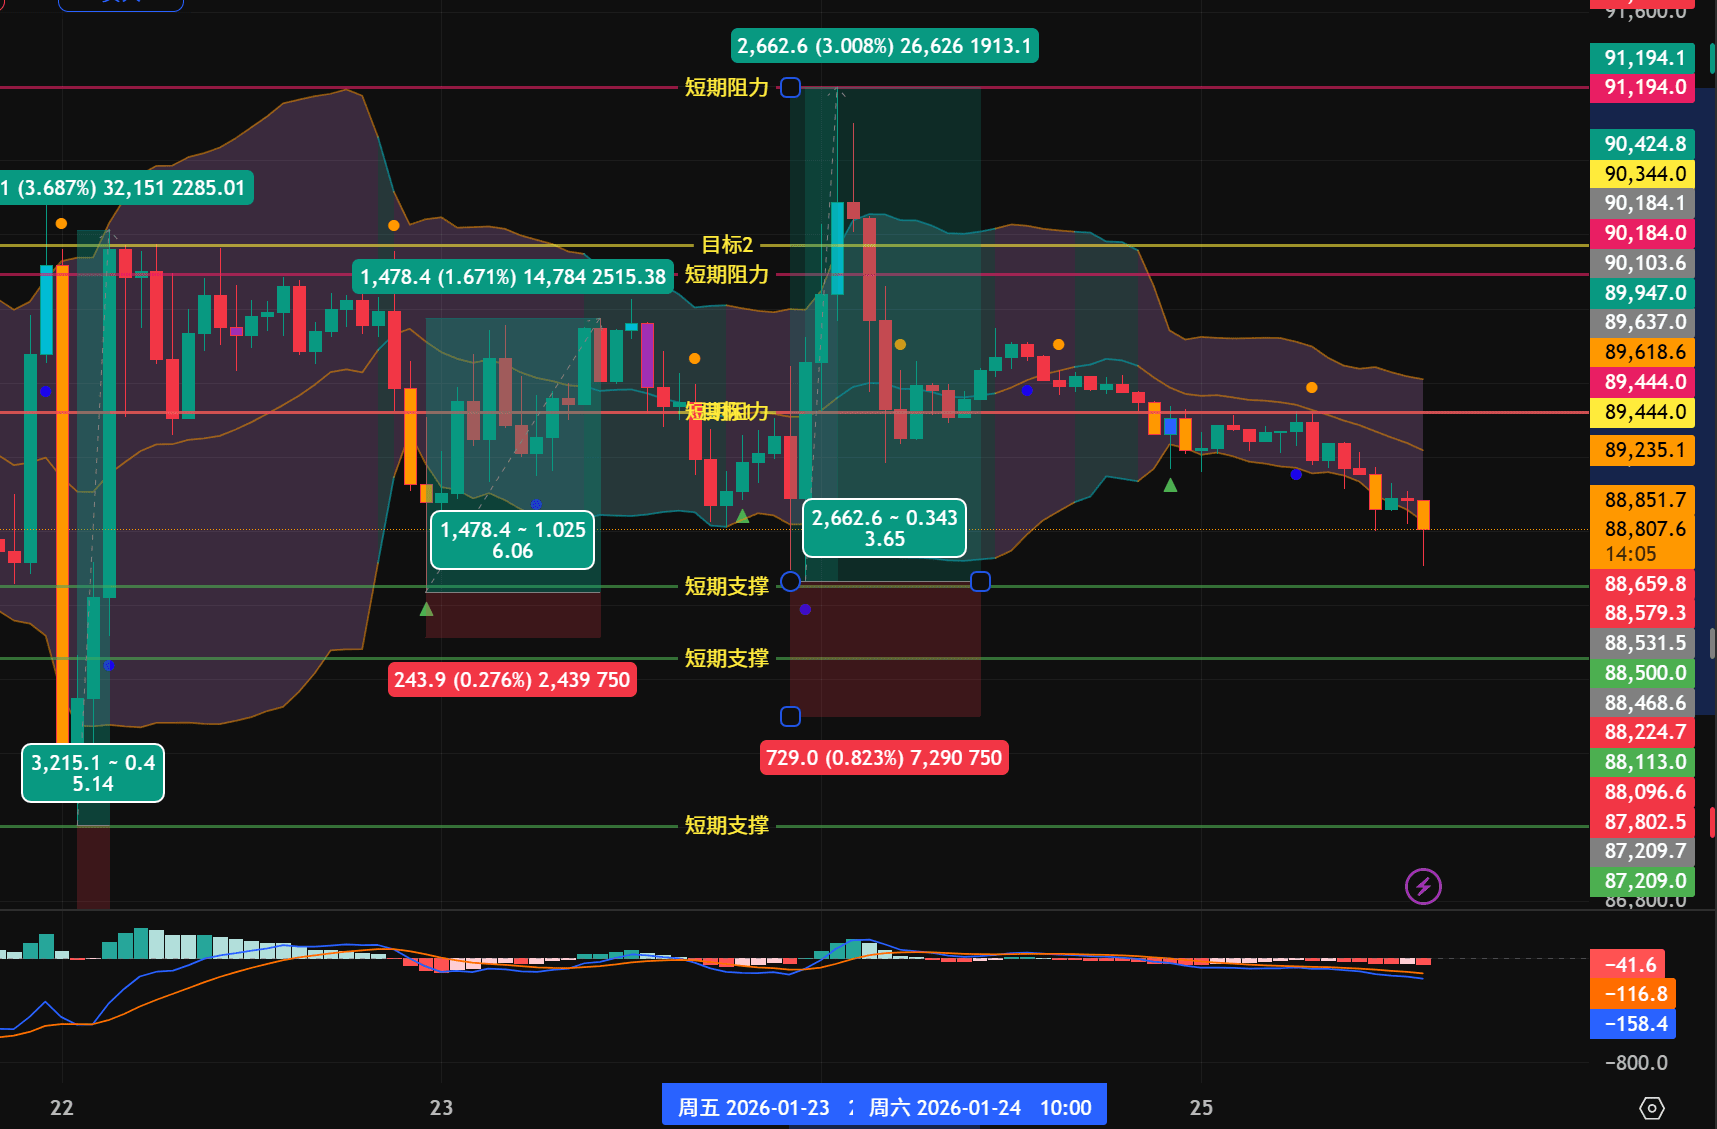
High and then fall: From the chart, BTC failed to stabilize after reaching 91,194 (the peak marked in green on the chart), subsequently entering a smooth one-sided downward channel. The red square area on the chart (729.0) shows that bearish momentum is being released.
At the gates: The price has precisely retraced to the green support line (88,659.8) on the chart. This is the current 'last line of defense'. If it breaks below here, the price will directly test the integer level of 88,000 or even the previous low of 87,209.
Weak indicator: MACD is running below the zero axis, and the fast and slow lines are opening downward, indicating that the current decline has not shown obvious signs of stopping. The weekend lacks incremental funds, and the market is in a state of 'bullish resistance is weak'.
1. Support and resistance levels (Flying Fish calculation version)
🟢 Short-term support (1-3 days, intraday/Monday morning)
88,500 - 88,660: Immediate support. The green support line marked clearly on the chart. At this moment, the price (88,762) is hanging at this line. If it can hold in the afternoon, there will be a small rebound.
88,113: Previous spike low point. The entity bottom area of the 'magic spike' on January 21.
87,209: Ultimate iron bottom (double bottom expectation). The absolute low point of this round of correction. If the main force wants to create a large double bottom, this is the extreme position.
🔵 Medium-term support (1-2 weeks, swing)
86,000: 50-day moving average lifeline.
84,500: Bottom of the large cycle box.
82,000: Fibonacci retracement 0.618 level.
🔴 Short-term resistance (1-3 days)
89,444: Core resistance (Target 1). The target line marked in yellow on the chart. Previously a support, it has now become the first 'lid' for rebounds after breaking.
90,184: Strong resistance (Target 2). The yellow pressure line above on the chart.
91,194: Recent high point. The top of this round of rebound.
🟠 Medium-term resistance (1-2 weeks)
92,500: Trend reversal confirmation point.
94,500: Area of previous historical high.
96,431: Historical high.
2. Comprehensive analysis and best entry strategy
Comprehensive view: The current 88,762 is in the 'support test of a downward continuation' phase.
Bearish logic: After hitting the top at 91k, the highs keep declining (Lower High), and it has just broken through the mid-axis at 89,444. The current momentum is downward, and short rebounds are in line with the trend.
Bullish logic: Although the trend is weak, 88,600 is a chart support, and it is very close to the major bottom at 87,209. The risk-reward ratio is suitable, making it appropriate for left-side ambush, betting on a 'double bottom' rebound.