
BTC is showing weakness today after a "ranging" Saturday and has not only created new downtrends but has also worked them out. Completely or partially.
Stable downtrends according to our indicator are shown today on three time frames - 45-minute, hourly, and 1.5-hour.
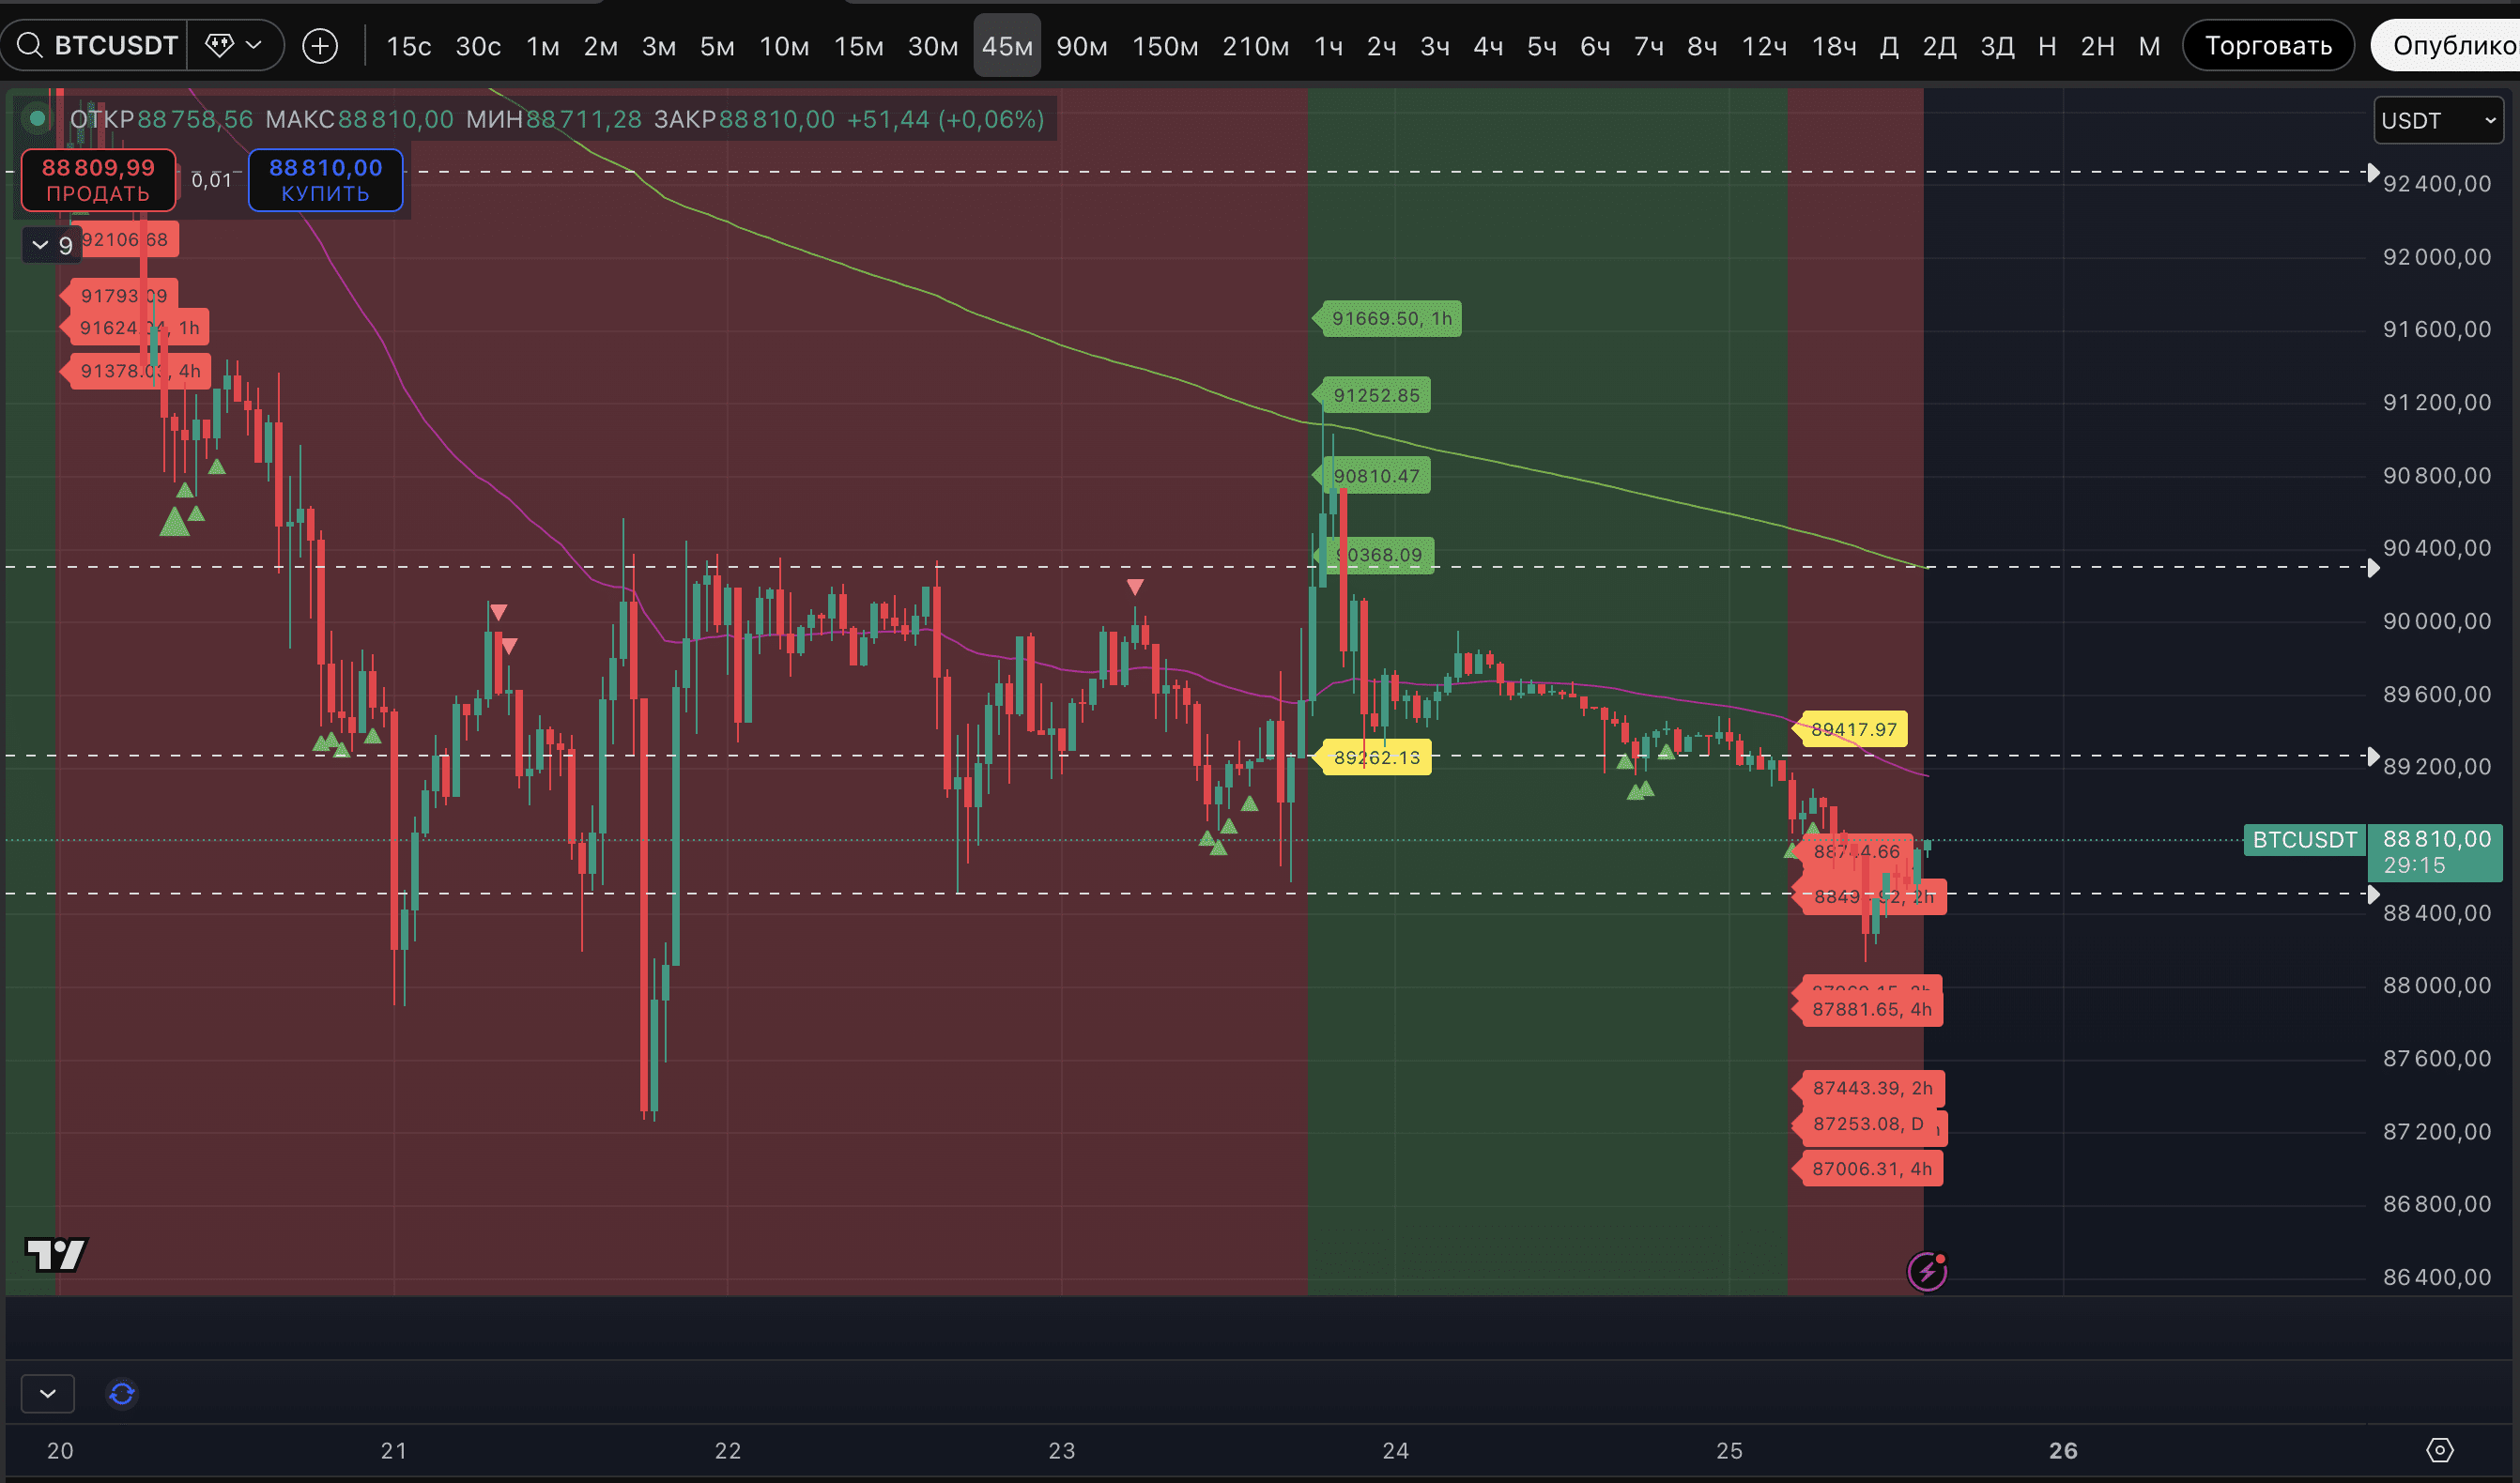
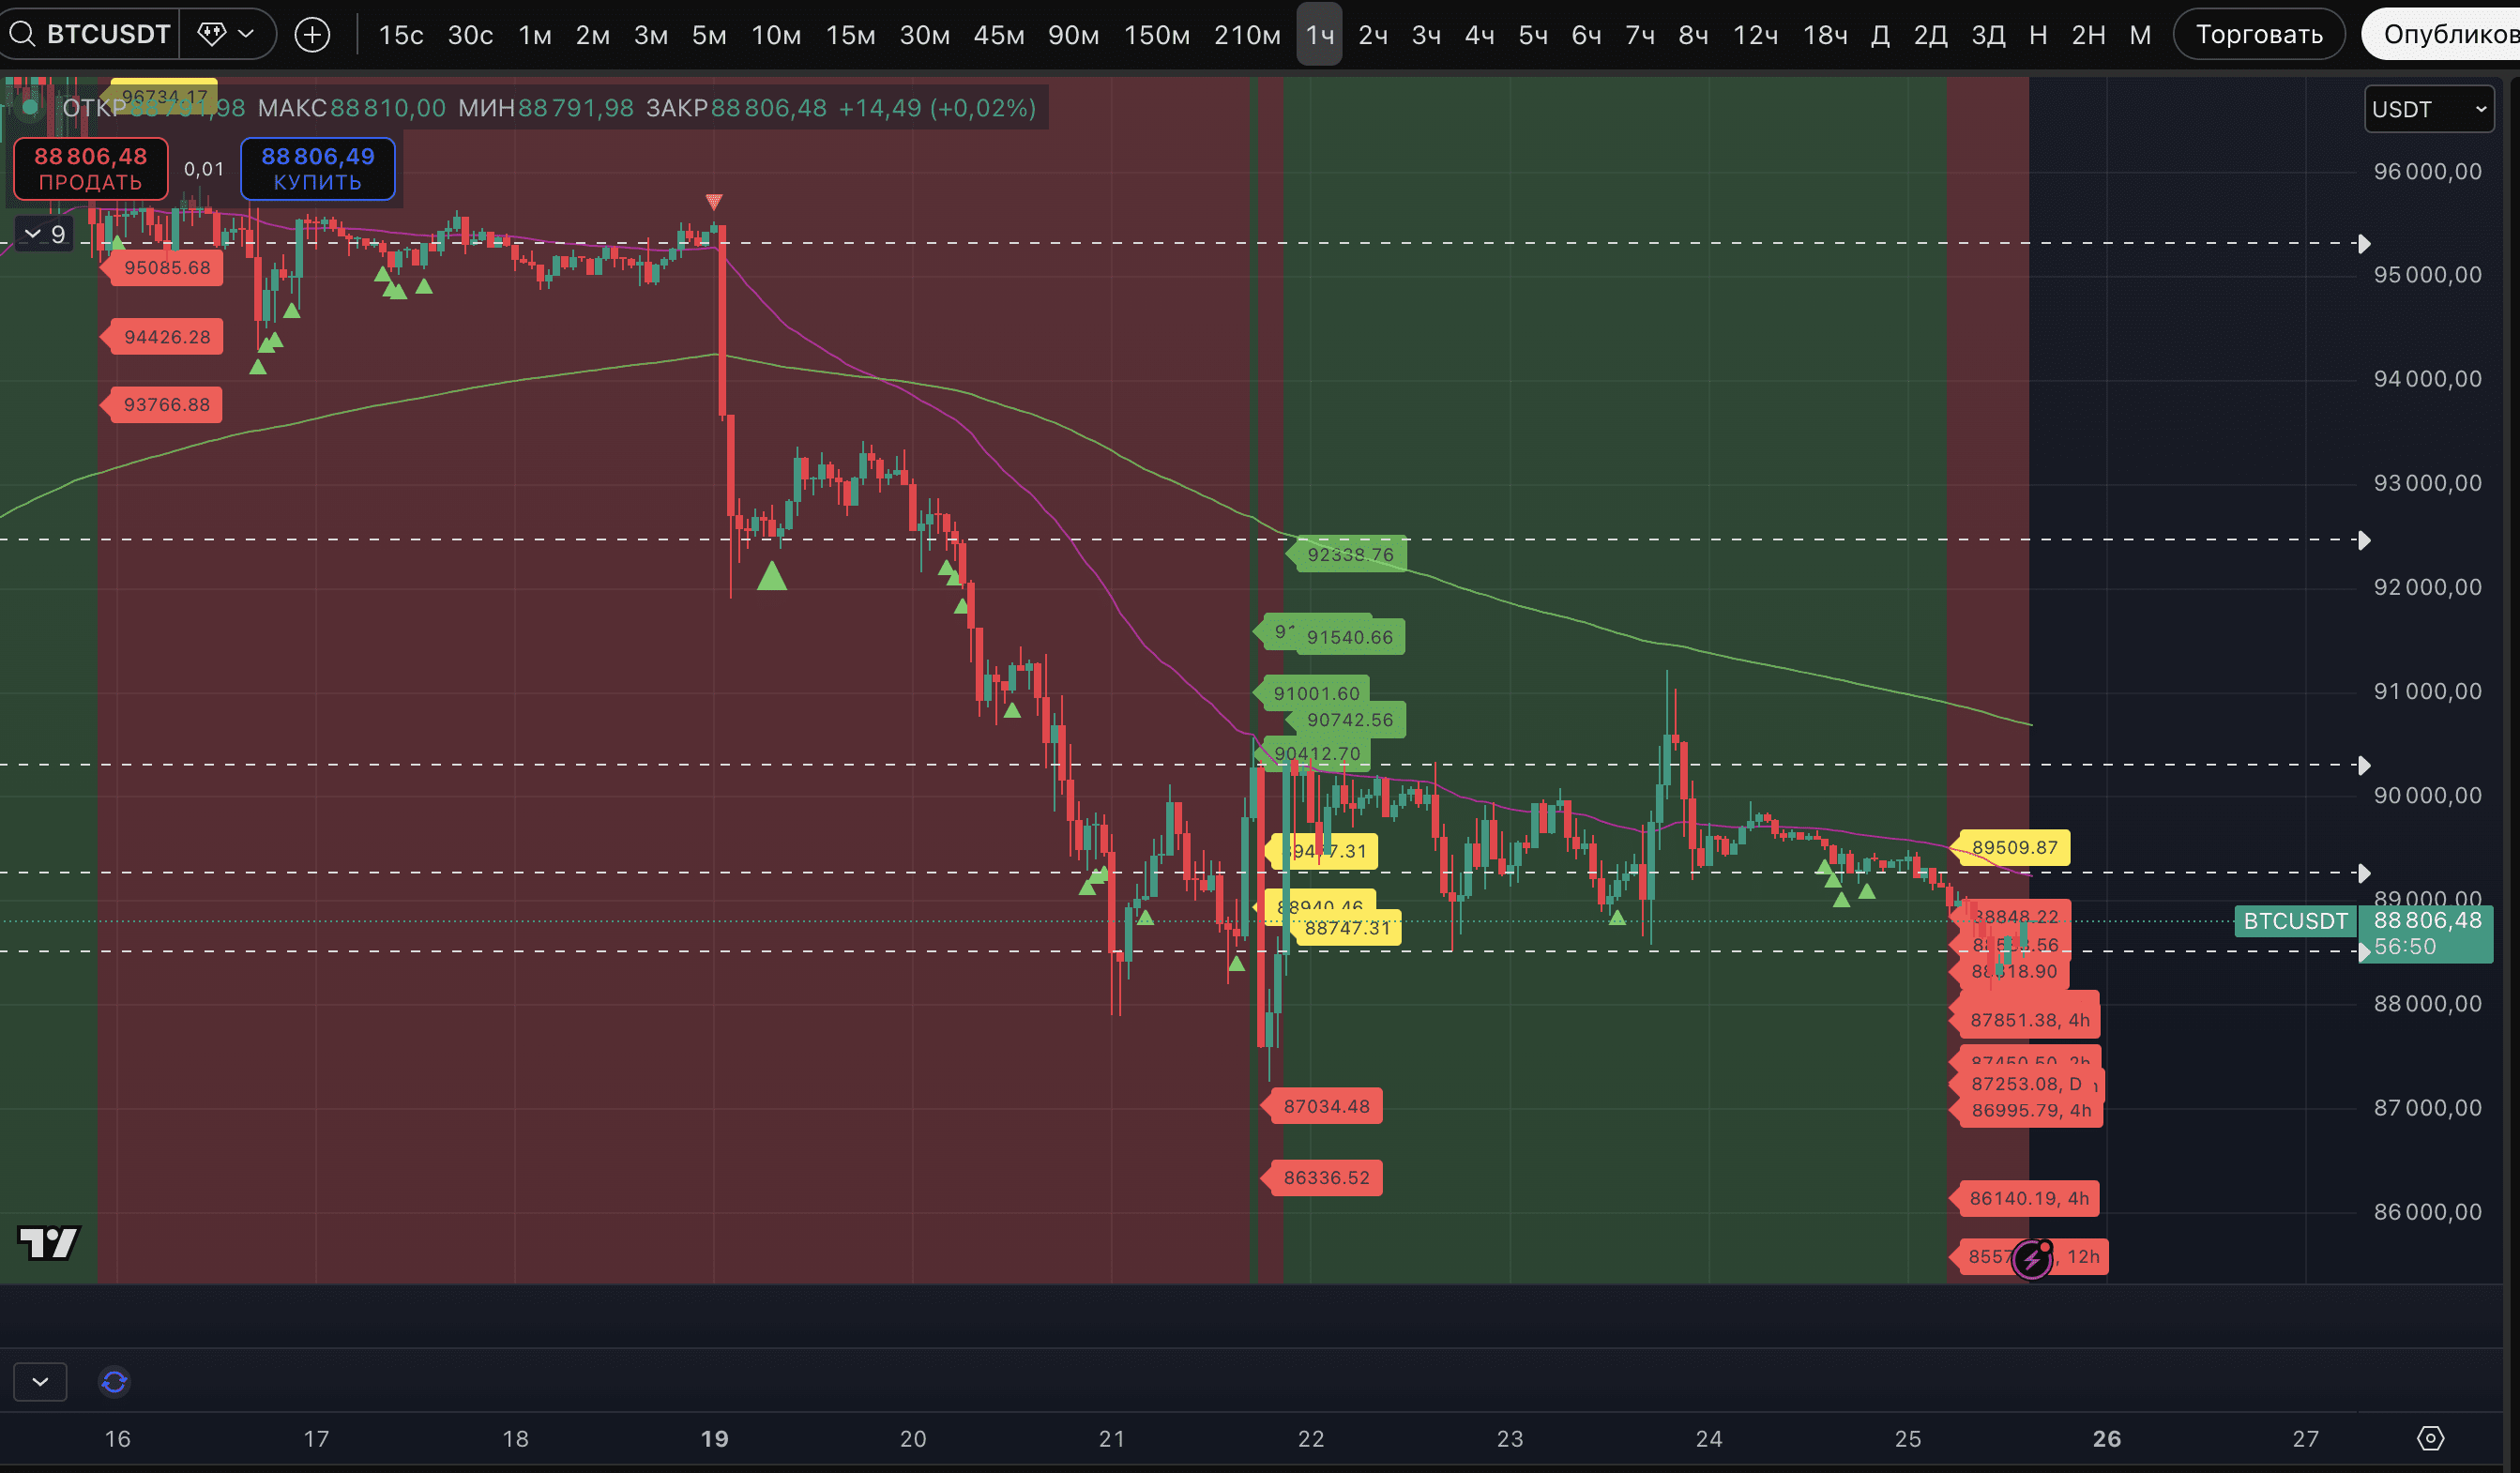
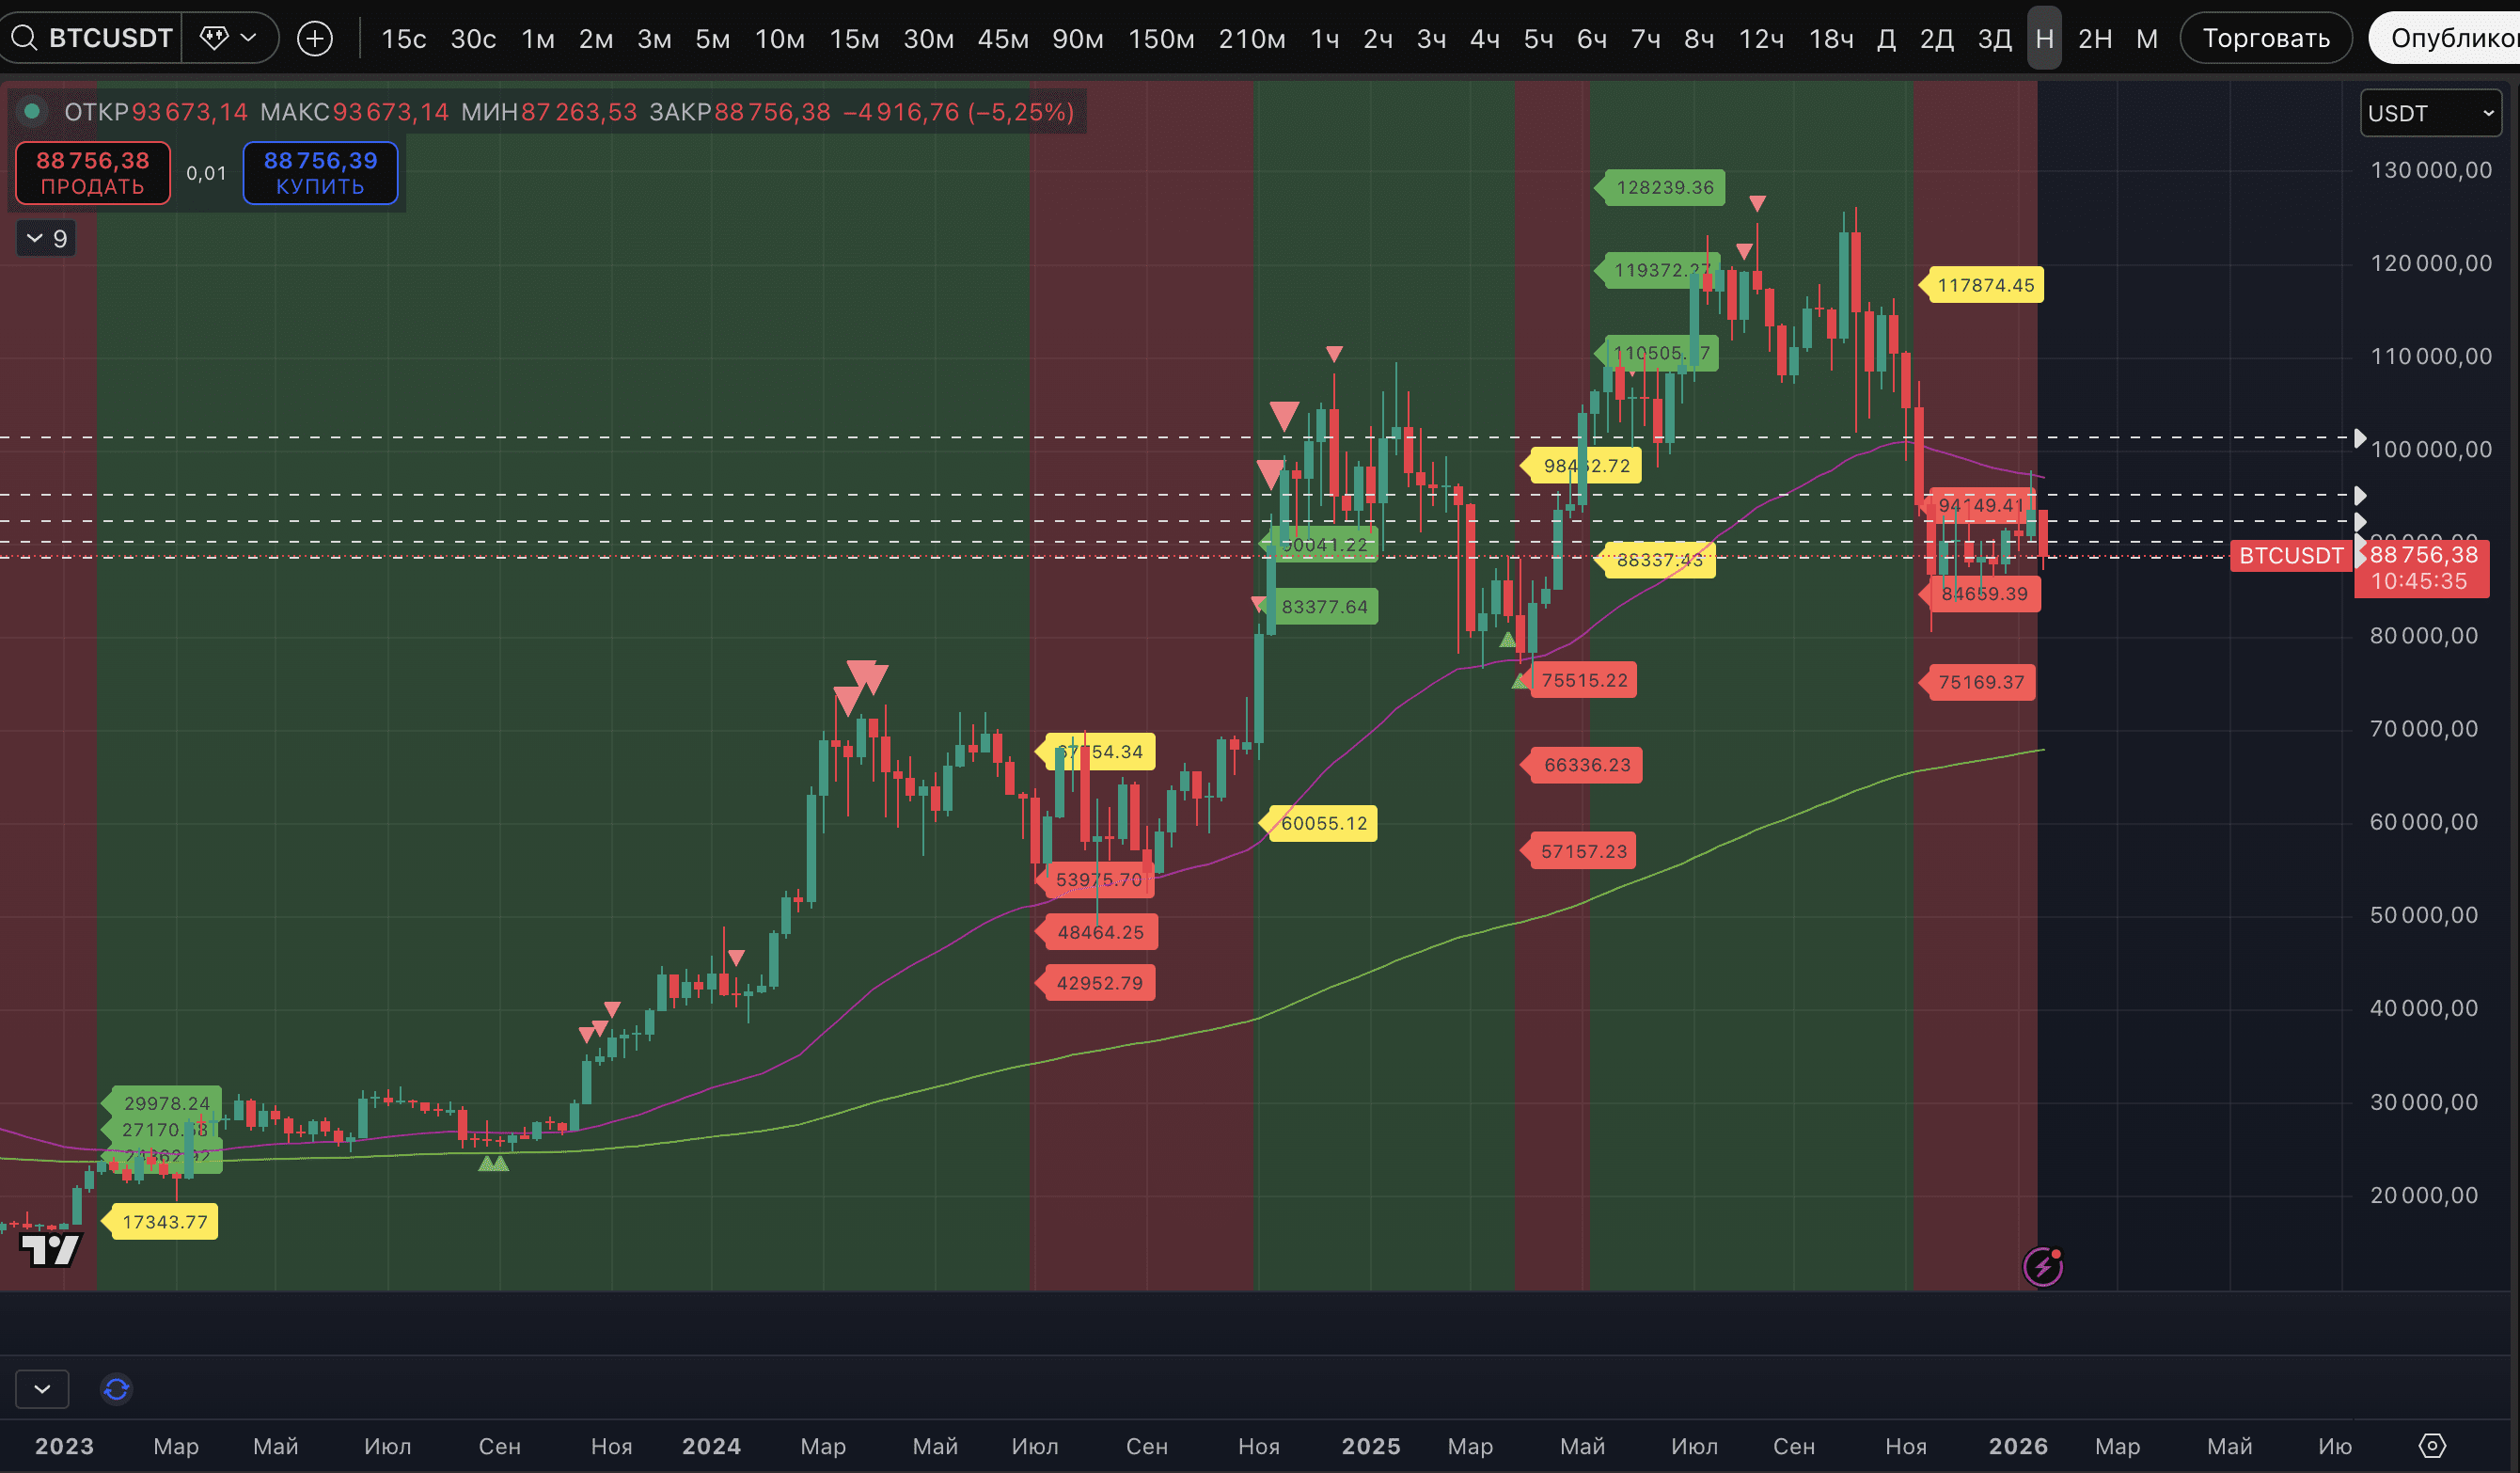
As seen from the screenshots, the basic targets for reduction have already been achieved on the 45-minute and hourly time frames. The last target of 87,861$ has not yet been reached on the 1.5-hour time frame.
The loss of the last of them, the 1.5-hour one, as the oldest - is the most important. And in general - we considered the possibility of closing our long position at a loss already when returning to a stable downtrend on the hourly timeframe.
For now, we are still not in a hurry to close the long position for three reasons:
- A signal from our P73 CryptoMarket Monitor about the likelihood of a rebound, which is made based on mass marks of potential lows on the 4-hour timeframe according to our indicator.
- The marks of the potential low according to our indicator on BTC and a number of other assets. And not only on the 4-hour timeframe. They are also present on the hourly timeframe, 1.5-hour, 2-hour, and 3-hour timeframes.
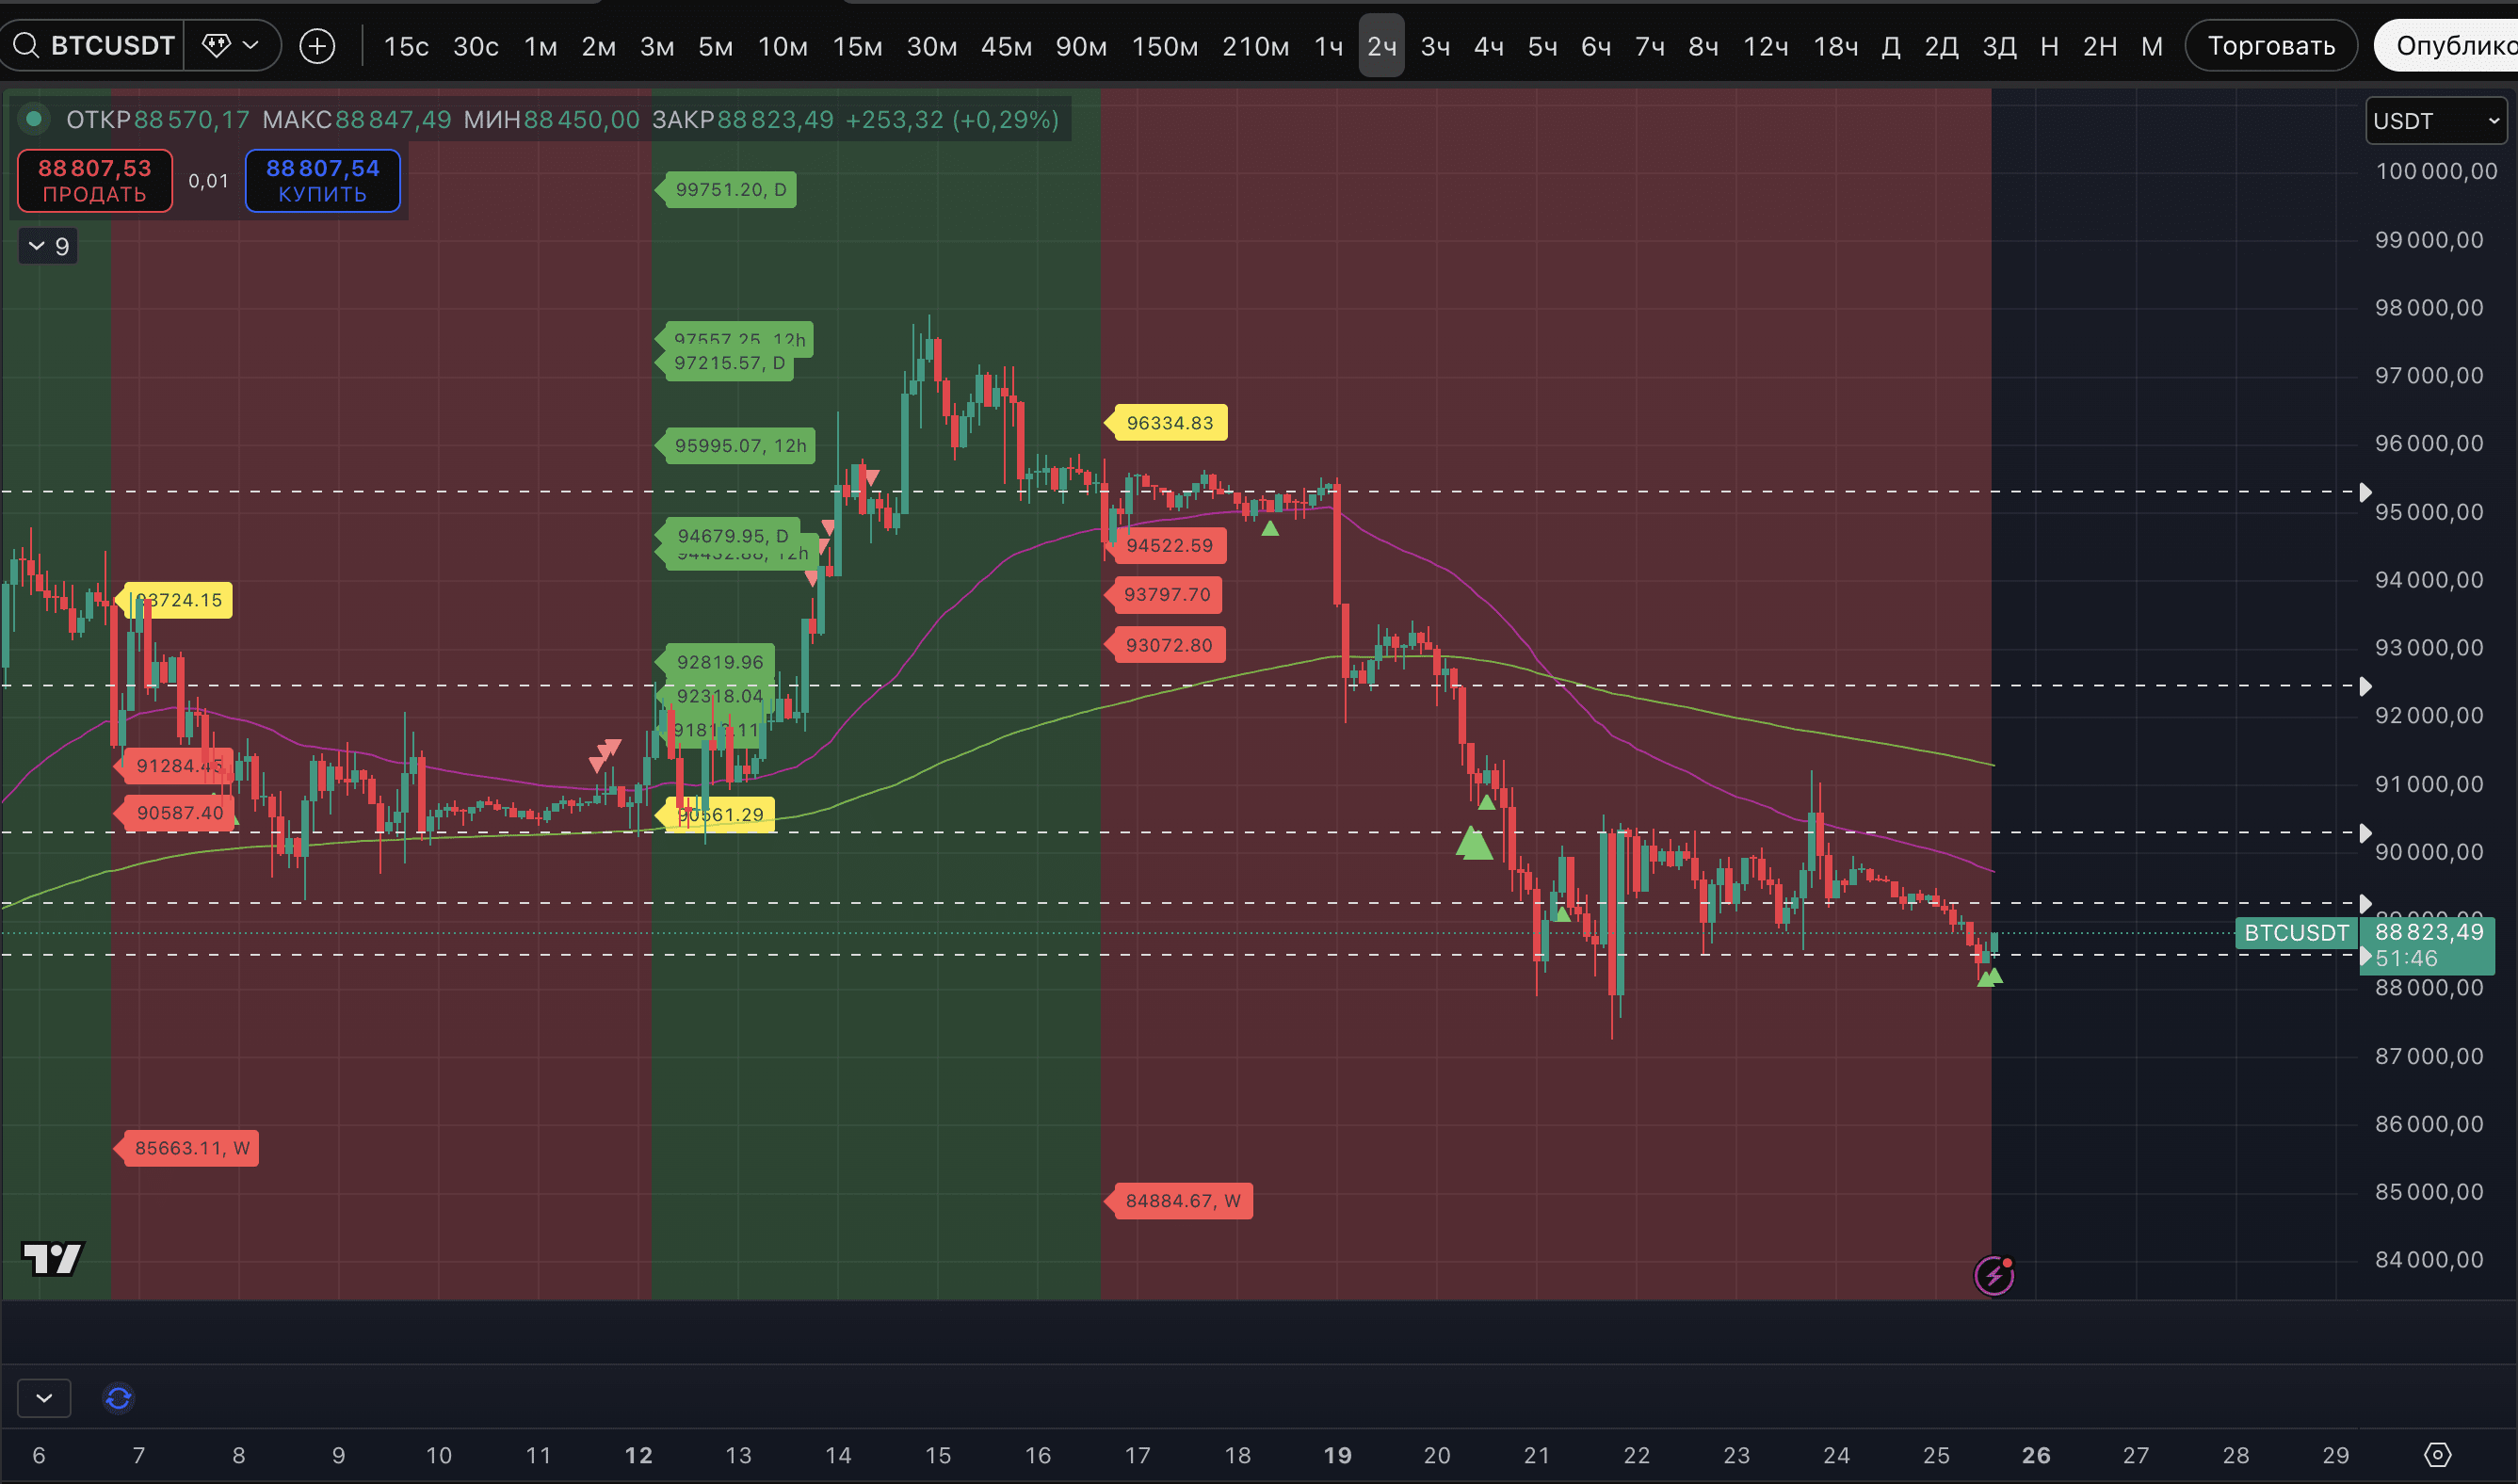
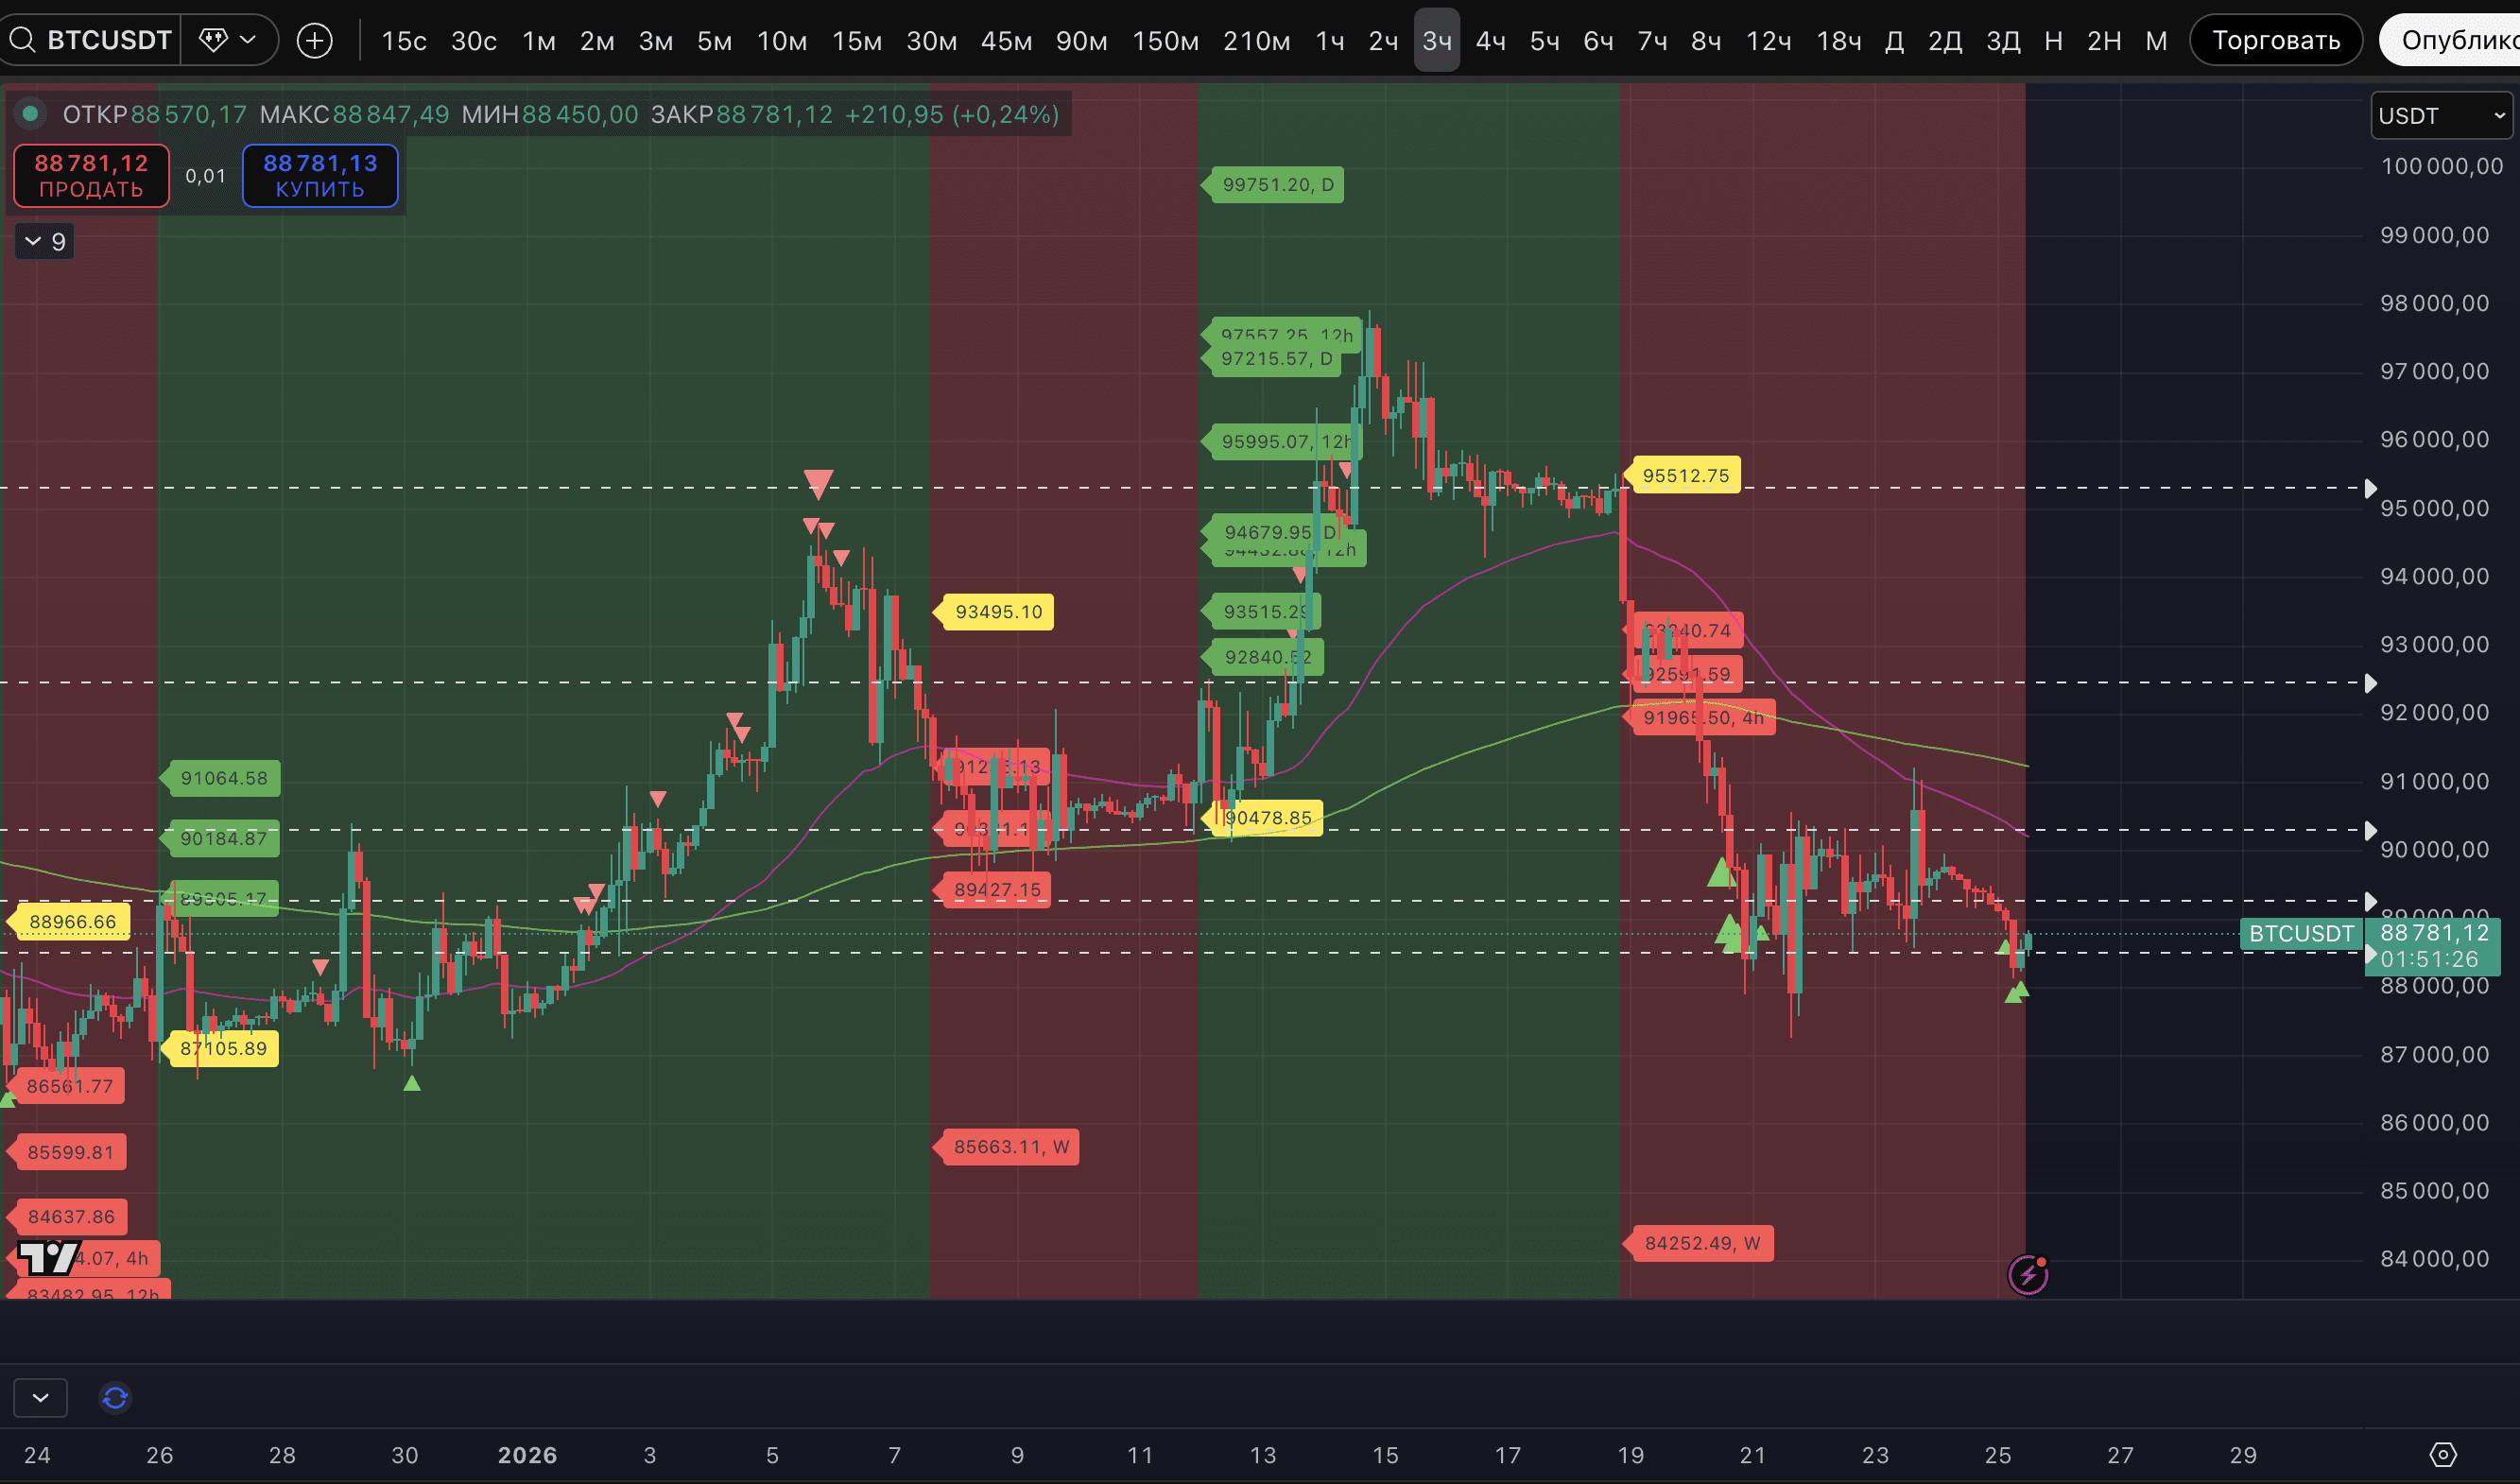
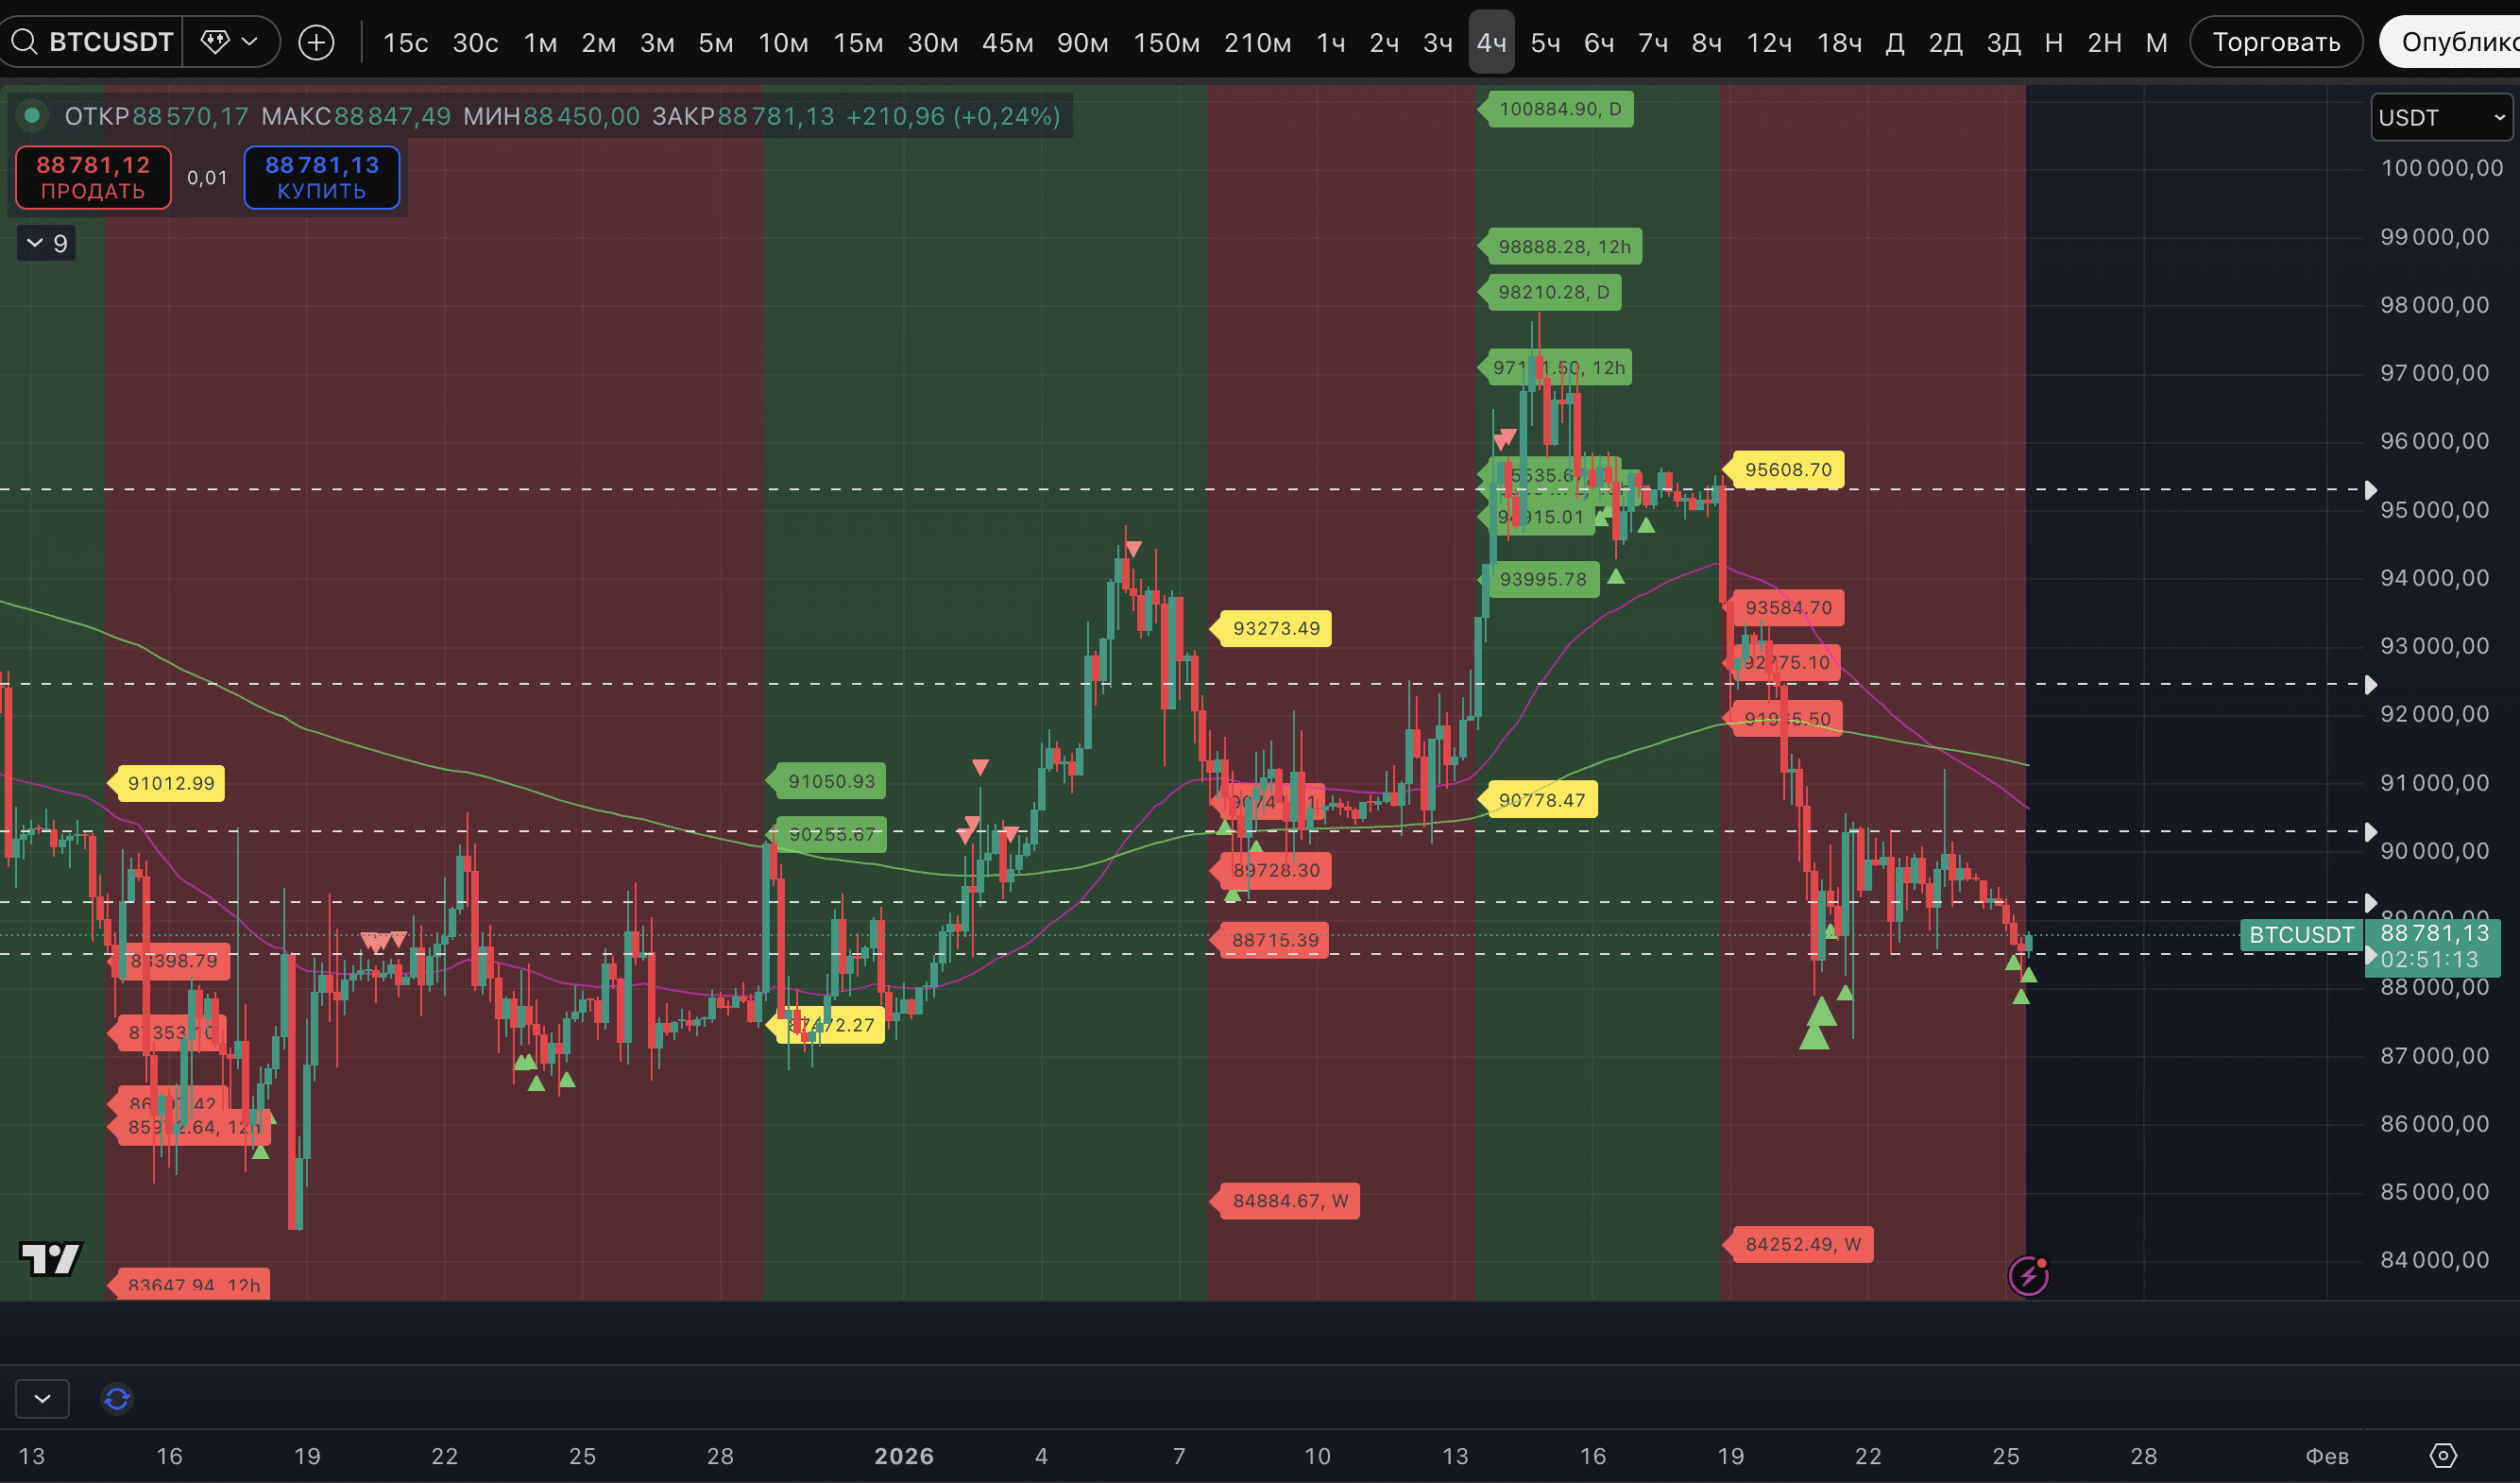
- The mark of the potential low for BTC and a number of assets on the daily timeframe. This should be highlighted separately.
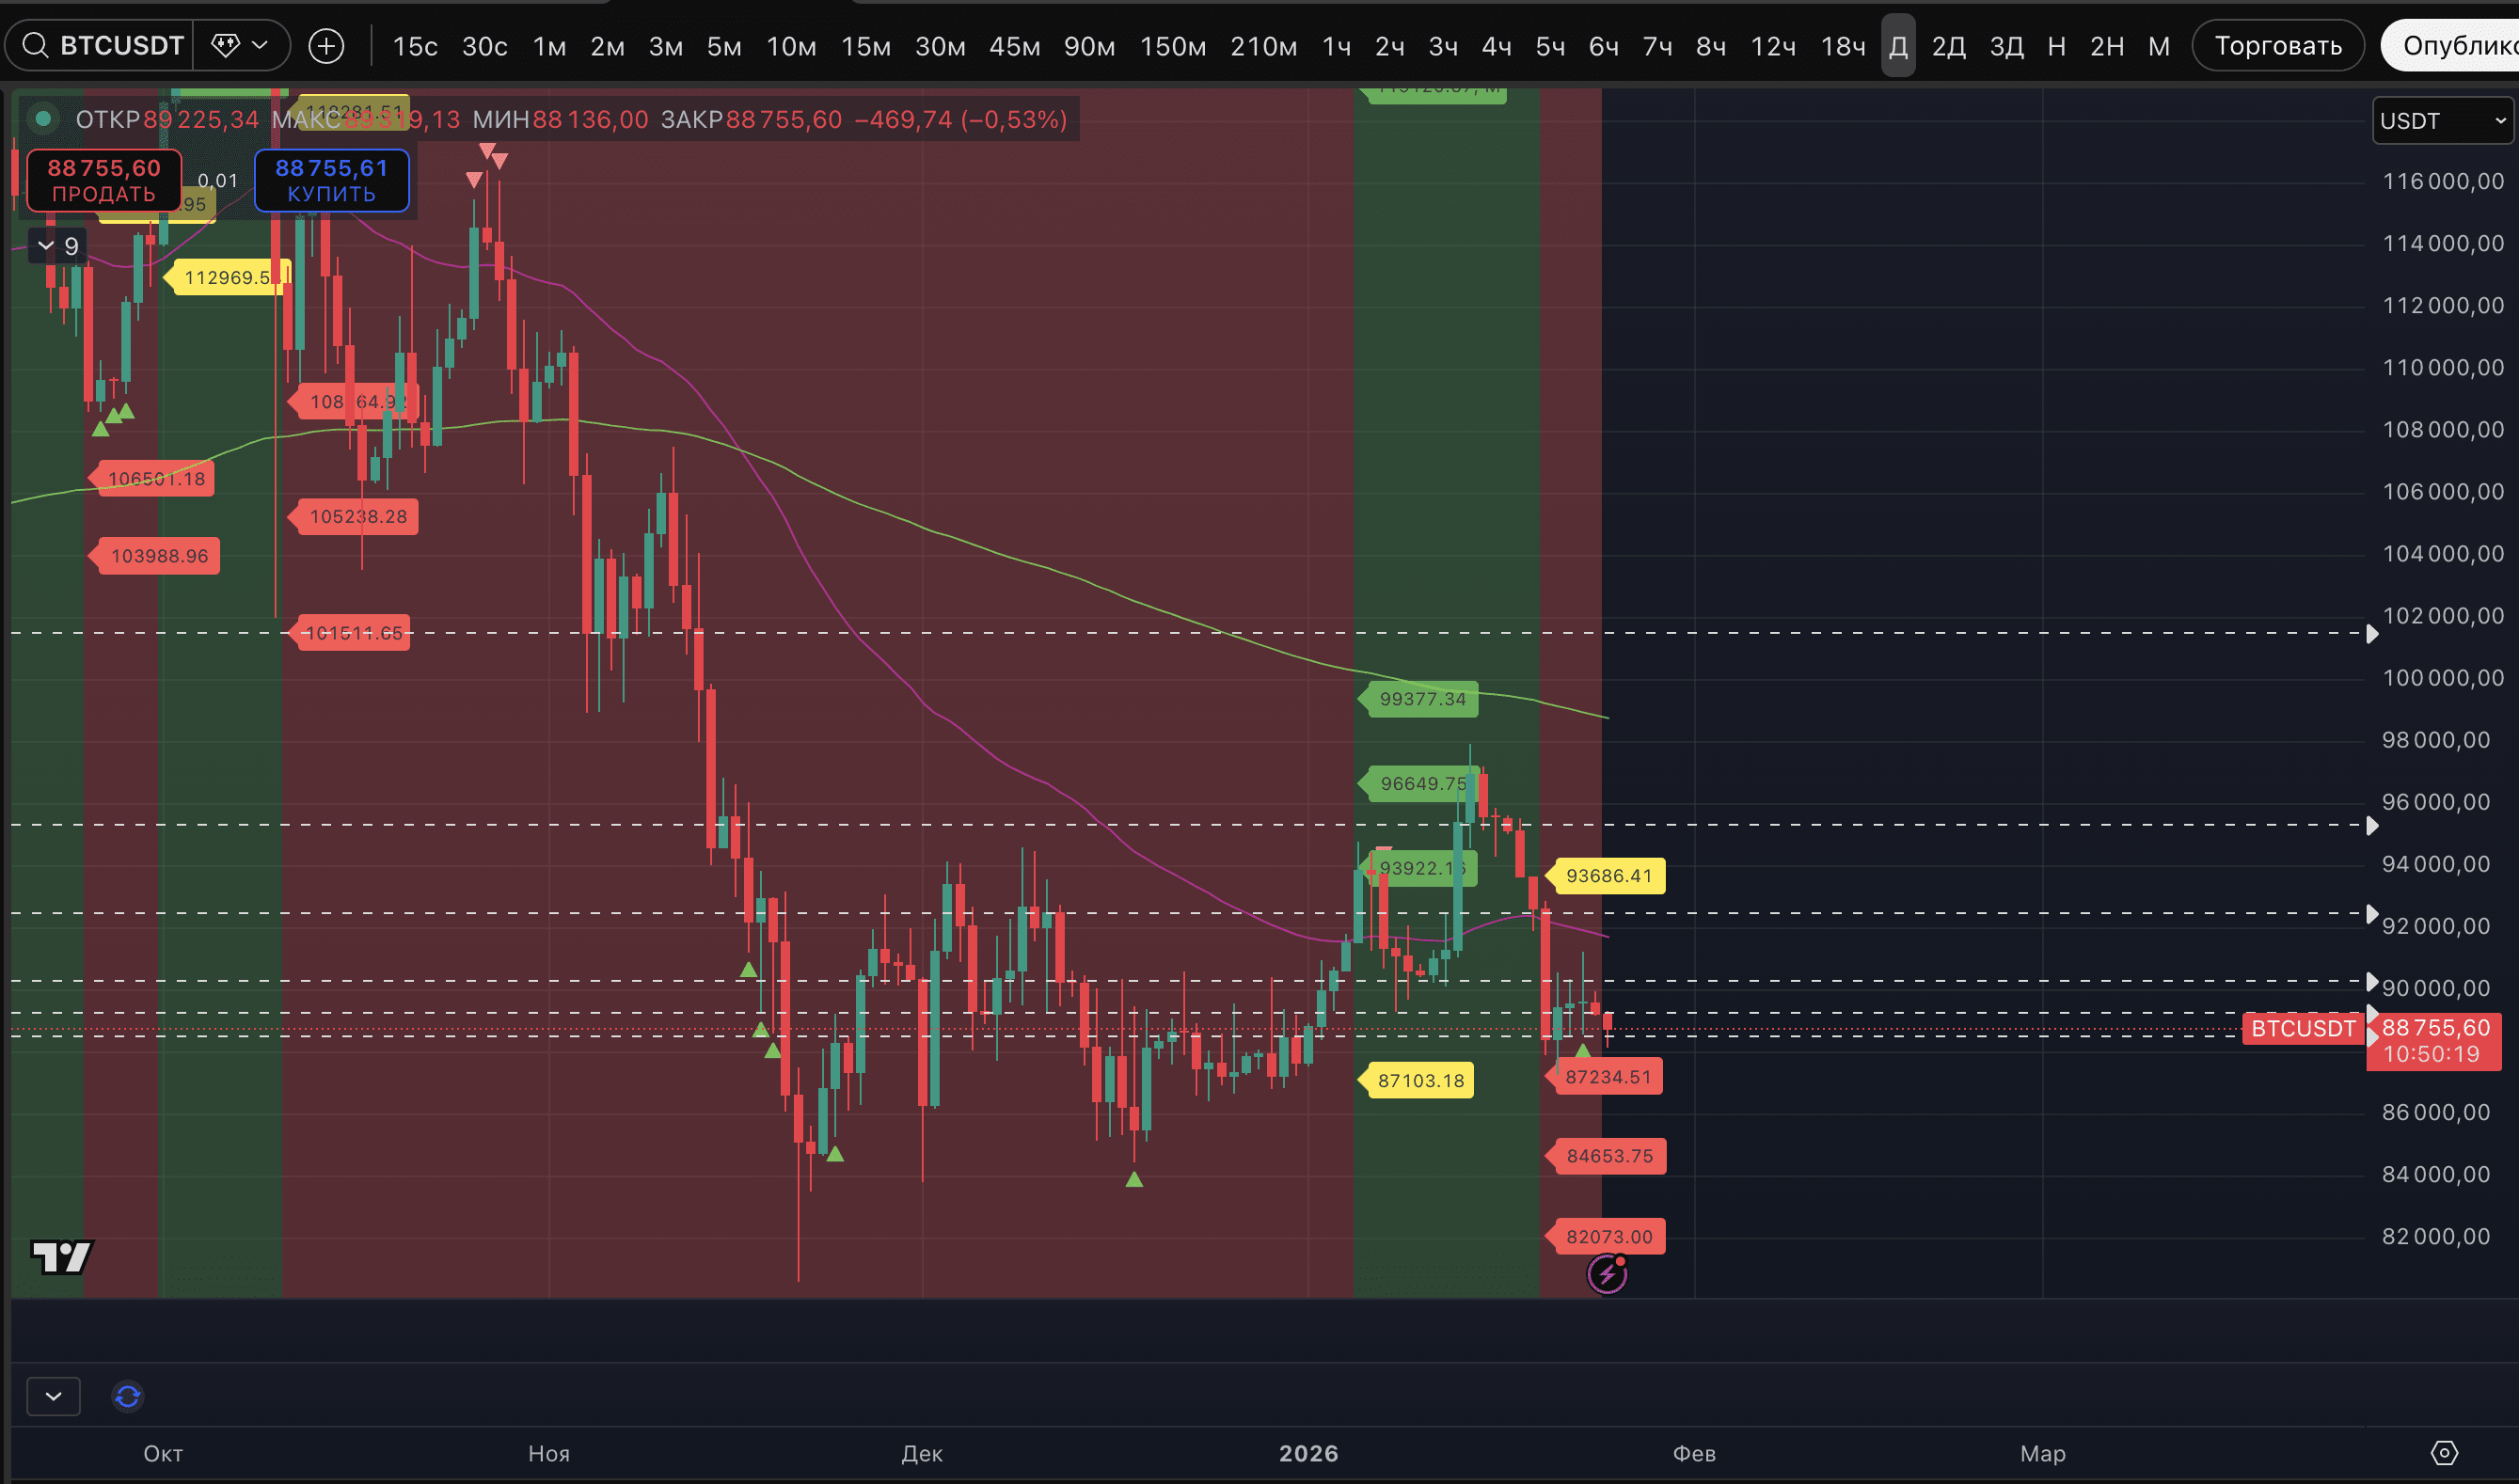
It was set, as already mentioned, on January 23. And as of now - it has not been broken. Moreover, yesterday's candle has already closed without a mark. This indicates that it was the first in the ascending structure and this is a chance for the bulls.
If the market does not show a sufficiently strong rebound capable of returning the prices of key assets to an uptrend at least on the hourly timeframe in the next 3 hours - we will return to the idea of closing the trade.
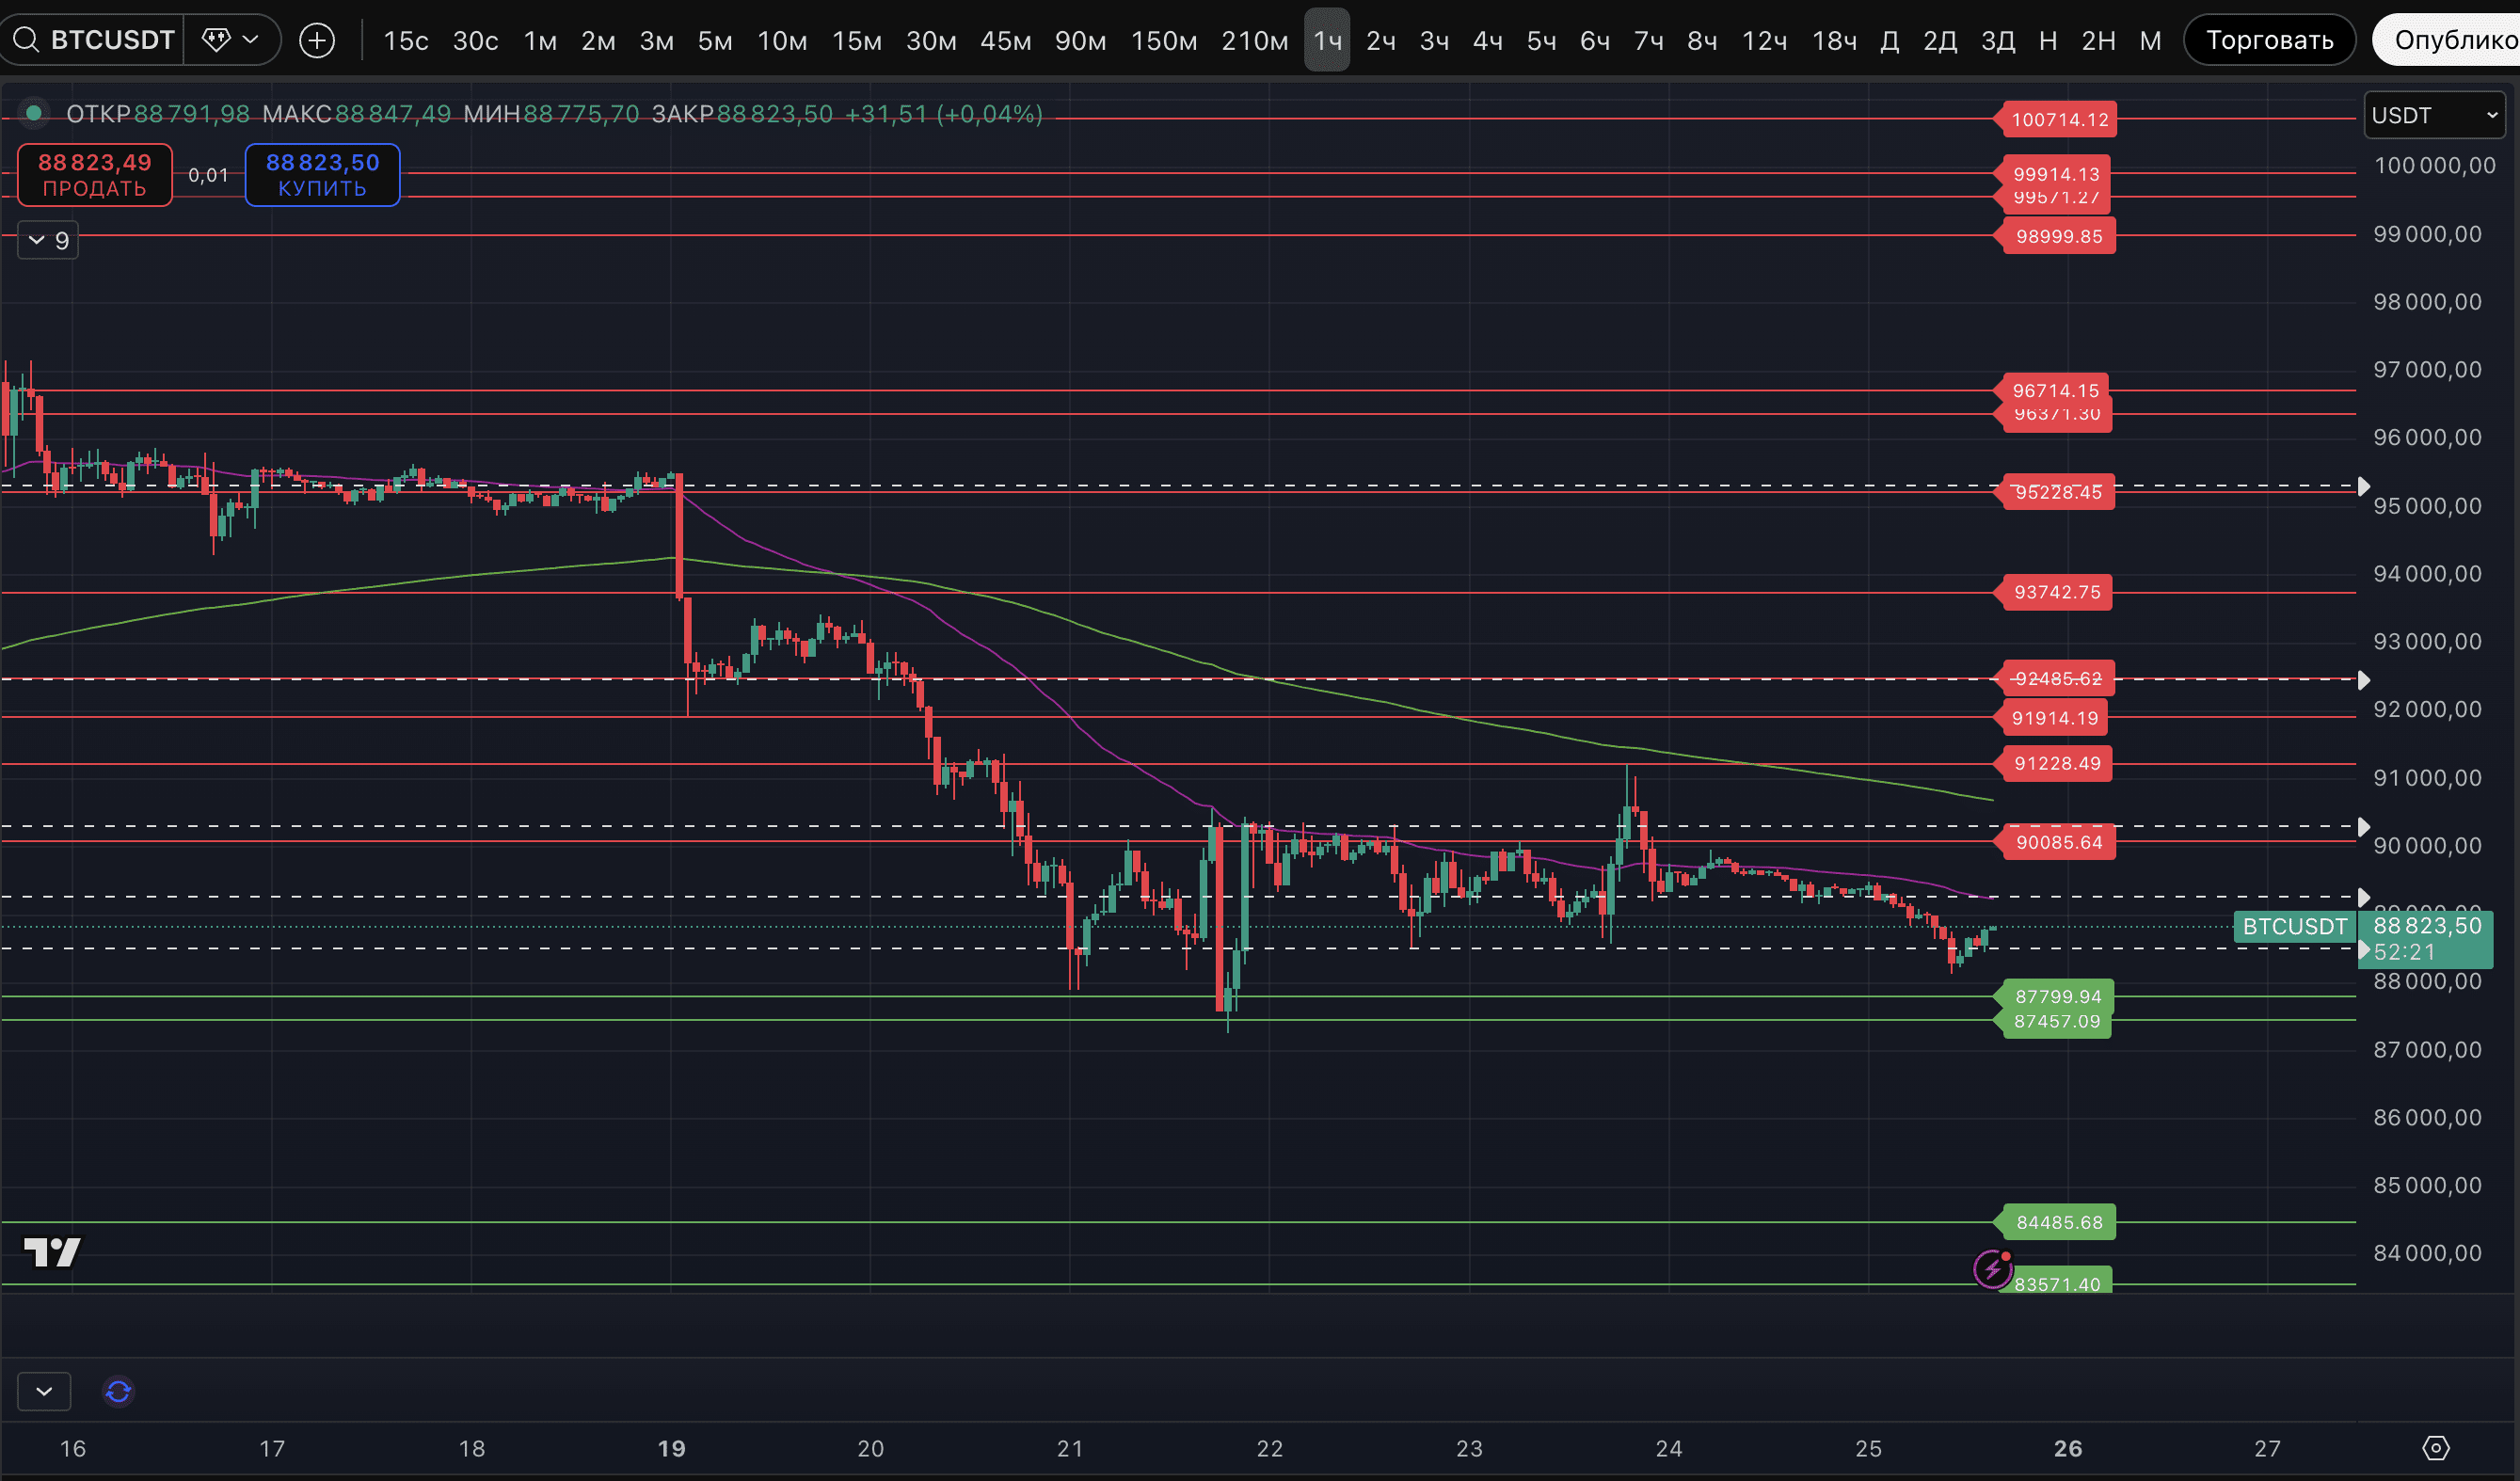
On the hourly timeframe, the situation is still so-so for the bulls - if the price goes to a new low, it will be able to collect all additional targets up to $86,995 at least. There ends the nearest density of targets. And overall, the nearest additional targets on the 1.5-hour timeframe go up to $84,252. But for now - let's observe without haste. There's no rush, closing the trade at the current price won't particularly save the allocated deposit.
We remember that according to the horizontal levels $87,799-$90,085 - this is the zone of impulsive movements. For the bulls, in the worst case, the key right now is not to settle below the range of $87,457-$87,799. Otherwise, the journey to the next support at $84,485 could be very quick.
By the way, on the 2-day timeframe #BTC is still holding a stable uptrend and remains above the potential breakdown level of $87,695.
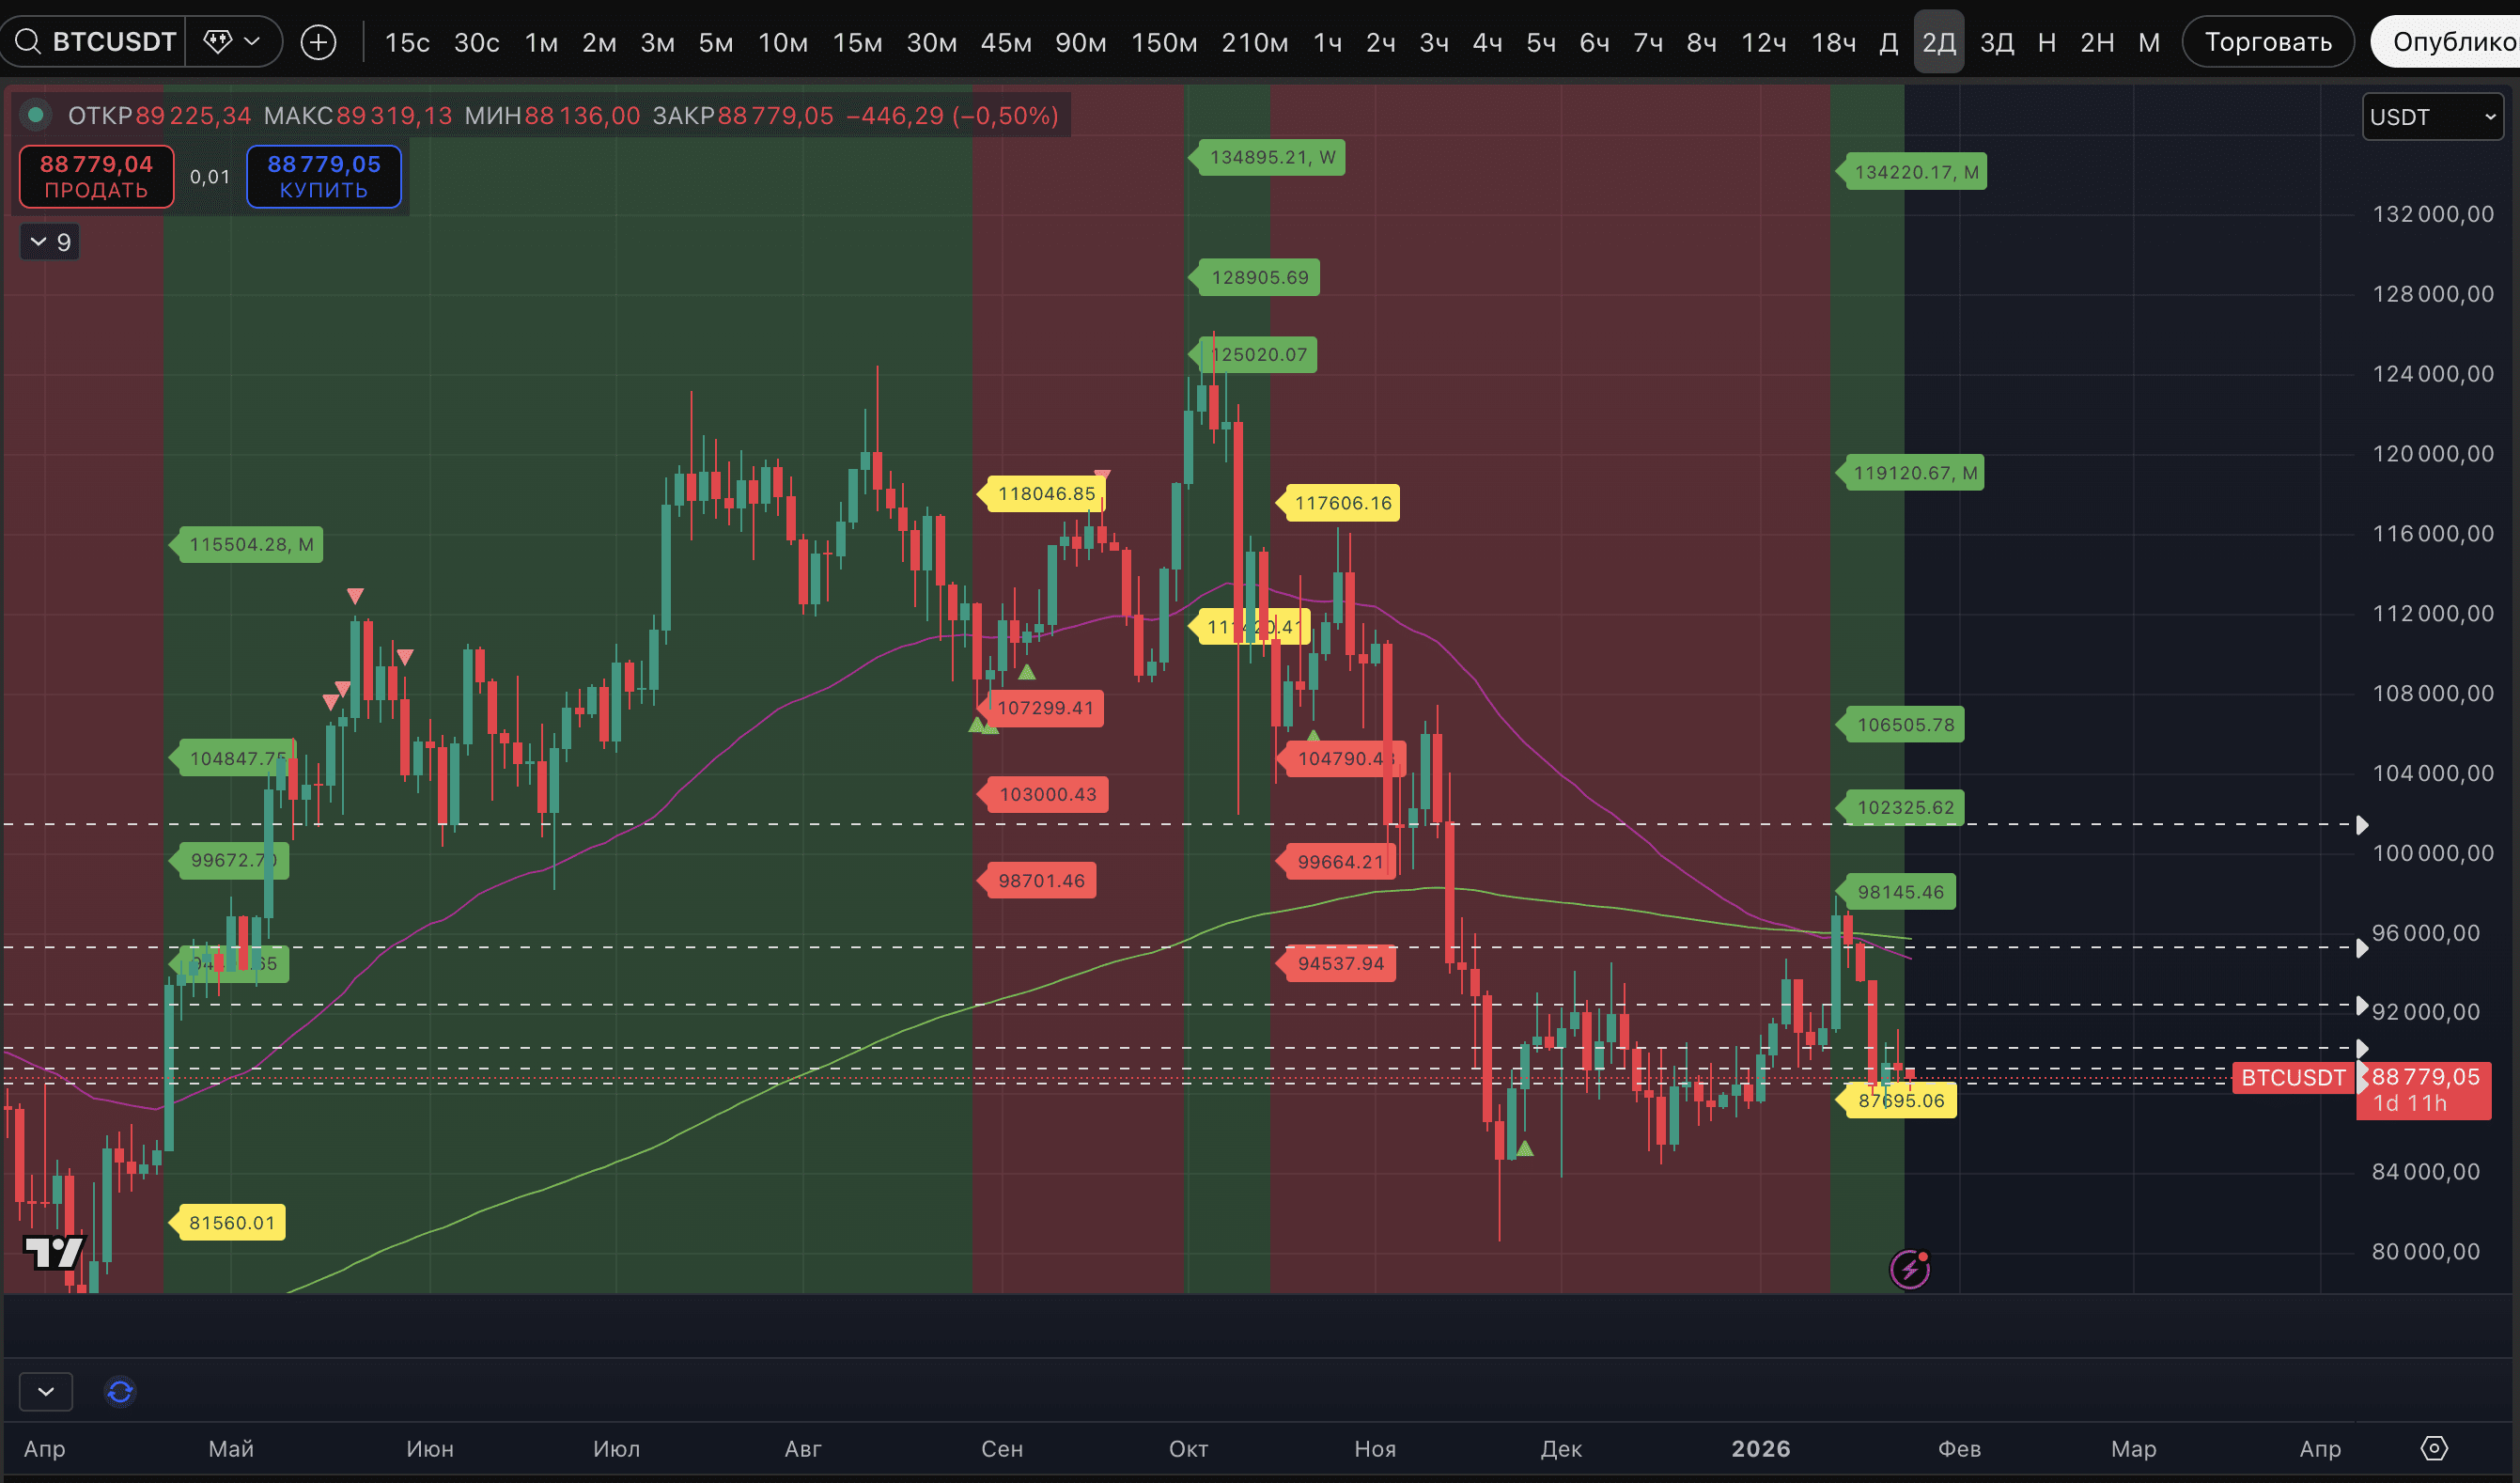
This is a positive signal for the bulls. Therefore, on this timeframe, the conclusion is the same - if we maintain this uptrend and start to grow from it, you won't see better levels for entering long positions in the near future. Soon we will either see a breakdown of a stable uptrend on the 2-day timeframe and after that the price will plunge down with renewed strength, or a return of a stable uptrend on the daily and 3-day timeframes, and a rise. We need to wait for a signal as a trigger for decision-making.
Which scenario are we leaning towards right now? Unfortunately, through a rebound, we are currently expecting further decline in BTC. The reason for this is in the weekly timeframe.
There, as we remember, the previous candle closed green but with a bearish shadow on top, during an unsuccessful attempt to break through the EMA 50. The current weekly candle looks even worse so far. If it closes in a similar fashion as now, it is unlikely to be a good sign for the bulls. There is no point in arguing with the trends and resistances that are being tested. If resistances are broken and downtrends are broken, then there will be something to please the bulls. For now, the current work for the bulls is just working from the extremes when signs of growth appear, with short stops.