26/01/26 Crypto Four-Year Cycle: Is it a Bull Market 'Shura Field' or a Bear Market 'Slaughterhouse'?
Hello everyone, I am the Young Master.
Since 2023, I have been doing (annual market operation summaries and outlooks for the coming year) every year, which has long become a fixed ritual in recording my trading journey. This commitment to myself and to the friends who have accompanied me should have been fulfilled by the end of 2025, but has been delayed due to trivial matters. I apologize to everyone for this. Finally, during the Spring Festival holiday, I can calm down and sort through the past, analyzing the market outlook. A complete version will be shared with everyone as soon as possible.

I. 2025 Market Review: The 'Grinding Moment' of High Consolidation, the 'Shura Field' for Spot Players
In November 2024, BTC broke through the 73,000 mark, laying the groundwork for expectations in the 2025 market. However, in the following year, the market entered a cycle of 'rising - falling - fluctuating': in October 2025, it reached a historical high of 126,000, and the market briefly boiled; by November, it faced a sharp drop. As of the time of writing, the price has retreated to around 87,800. A year-long high-level consolidation has been an 'extreme test' for spot holders: the sudden drop in February caught many off guard; after the new high in October, before they had time to realize profits, the November correction had retraced most of the gains, even turning into a floating loss.
The protagonist's spot layout began around the time of the election of Dong Wang — after building a position near 72,000 in BTC, I held on all the way. ETH was entered around 2500 points. Unexpectedly, ETH once dipped to a low of 1385 and also surged to a peak of 4956. Amid such drastic fluctuations, most of the long-held profits grasped in hand have been 'eroded' by the repeated pullback of the fluctuating market.
Fortunately, there is an account dedicated to swing trading, which has captured a few certain opportunities during the fluctuations, serving as one of the few comforts in this year's operations, but overall, the operational difficulty is far greater than before.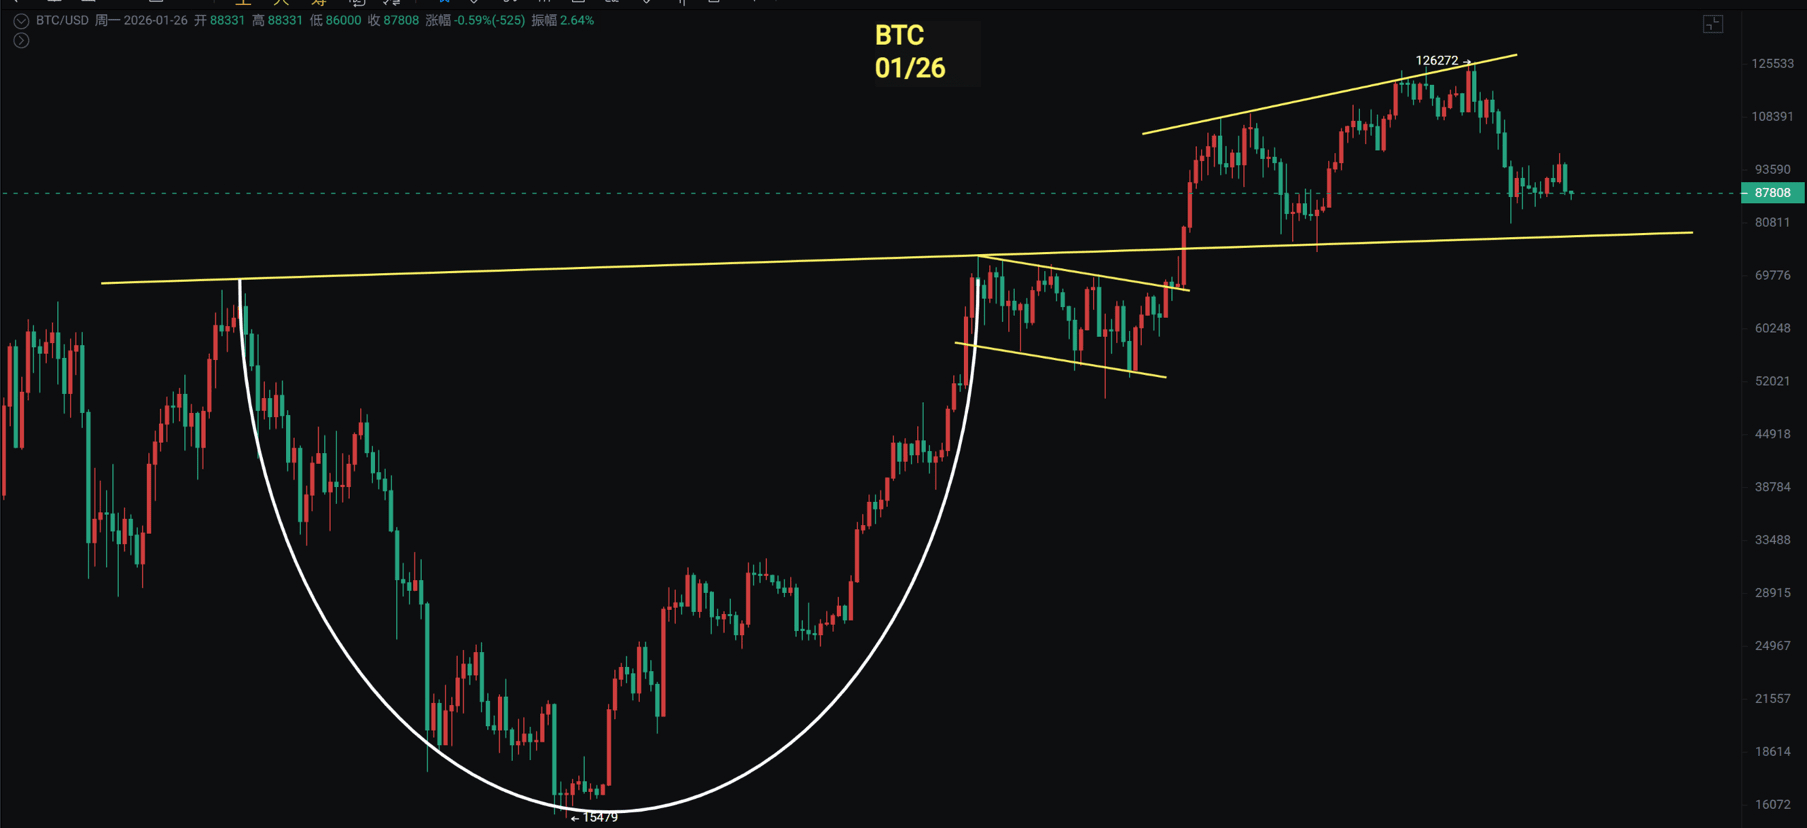
2. The truth about this round of bull market: the 'crossing calamity' of old investors, the 'failure' of old logic.
As a half-old investor who entered the market after '312' in 2020, I have experienced several rounds of bull and bear cycles but have never seen such a 'difficult to make money' bull market: the scene of 'national carnival' in past bull markets is no longer seen, and it is rare to see a large number of new investors with zero foundation rushing into the market; those KOLs and OGs who made huge profits in the previous two bull markets have all fallen into difficulties this time — some have been liquidated and exited the contract market, and many projects have gone to zero and quietly delisted. I have also been quite lazy this year, with a very poor profit effect.
3. Current summary analysis of the actual market: The large cycle is shrouded in fog, at the crossroads of opportunities and risks.
1. First, looking at the large cycle monthly chart, the monthly MACD is about to dead cross down at the zero axis for the third month. The monthly chart has broken below MA20, still bearish. The OBV energy wave indicator is about to break below the previous low point during the 80600 pin bar, but there is still a bit of distance to 74,500.
2. Weekly engulfing pattern, MA20 and MA60 crossing, which is also the first time since the bear market of 2022. The MACD is shortening but has not crossed the zero axis, and there are signs that the fast and slow lines will continue to move downward.
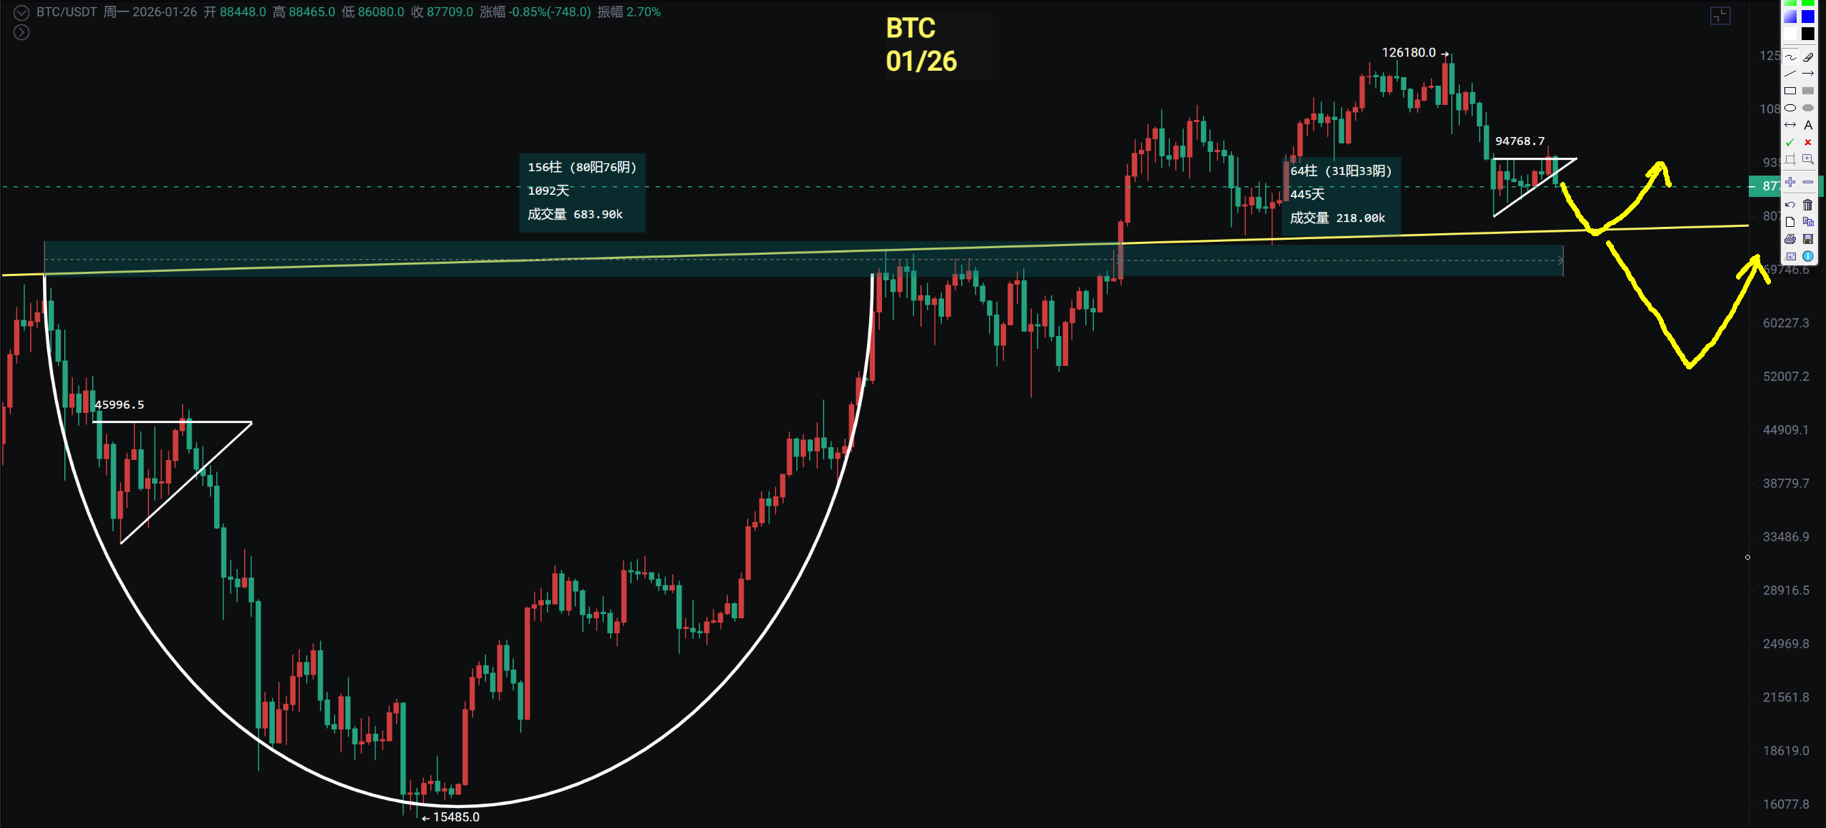
The pattern is similar to the early bearish trend of 2022. After the false breakout of the ascending triangle, it fell below 32,900, starting a deep bear market. Currently, it has tested the Fibonacci levels of 0.382, 0.5 (70800), and 0.618 (57700).
The false breakout of the ascending triangle on the daily chart fell to 86000, and it still hasn't found a bottom. Although there was a pin bar rebound in the short term of 4 hours, it did not break the pressure. It is highly likely to break the previous low of 80600. The weekly MA120 is just around 80000, so we need to see if it can fake a breakout and rebound around this area; otherwise, the down wave C will drop deeper.
5. Time and space: Since the breakout of 73,000, it has been 445 days, and from the last bull market high of 69,000 with a rounded bottom + a rising flag pattern over 8 months in 2024, it has been 1092 days. From the perspective of time and space, it is still bullish and may maintain high-level fluctuations, only uncertain about where this drop will rebound. In an optimistic scenario, it may drop to 73,000 and rebound, while in a pessimistic scenario, it will be above 50,000.
4. Bitcoin's fluctuating momentum replicates the historical path of gold ETFs: the 'dormant moment' of fluctuating accumulation, the 'historical replication scene' of market performance.
Gold ETF
1. Listed in November 2004, gold price was 444 / ounce, only up 9% in the first year. 2. Experienced 2-3 years of high-level fluctuations + corrections, digesting institutional inflows. 3. Finally erupted: low point in 2009 of 800 → peak in 2011 of 1900+ (up 130%). 4. Total increase from 2004 to 2011 of 330%. The core: the institutional funds brought by ETFs need time to settle and gather strength.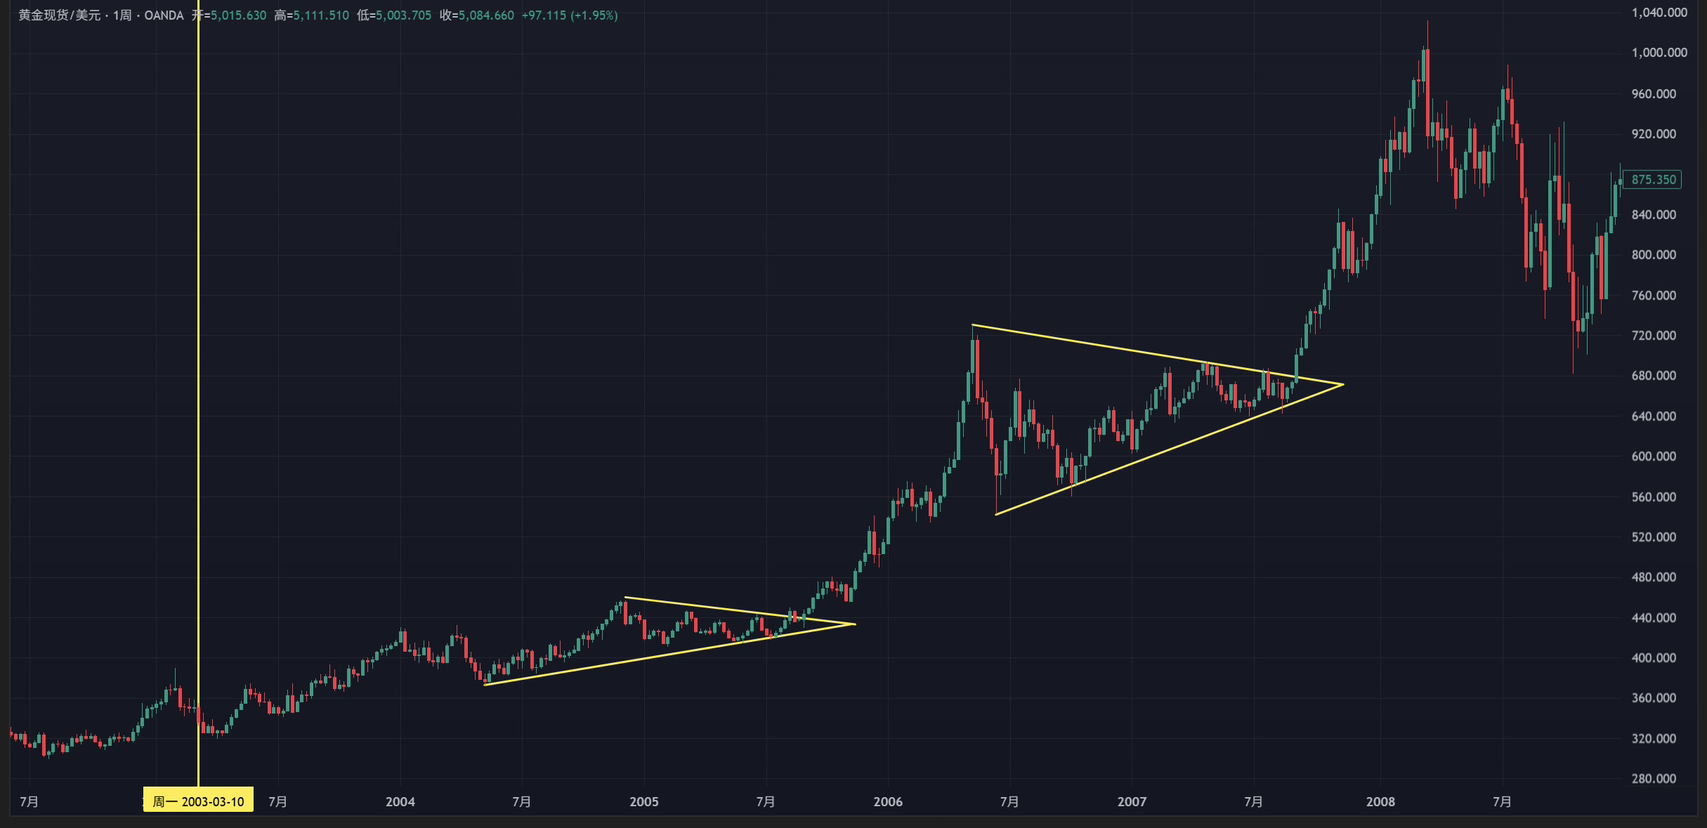
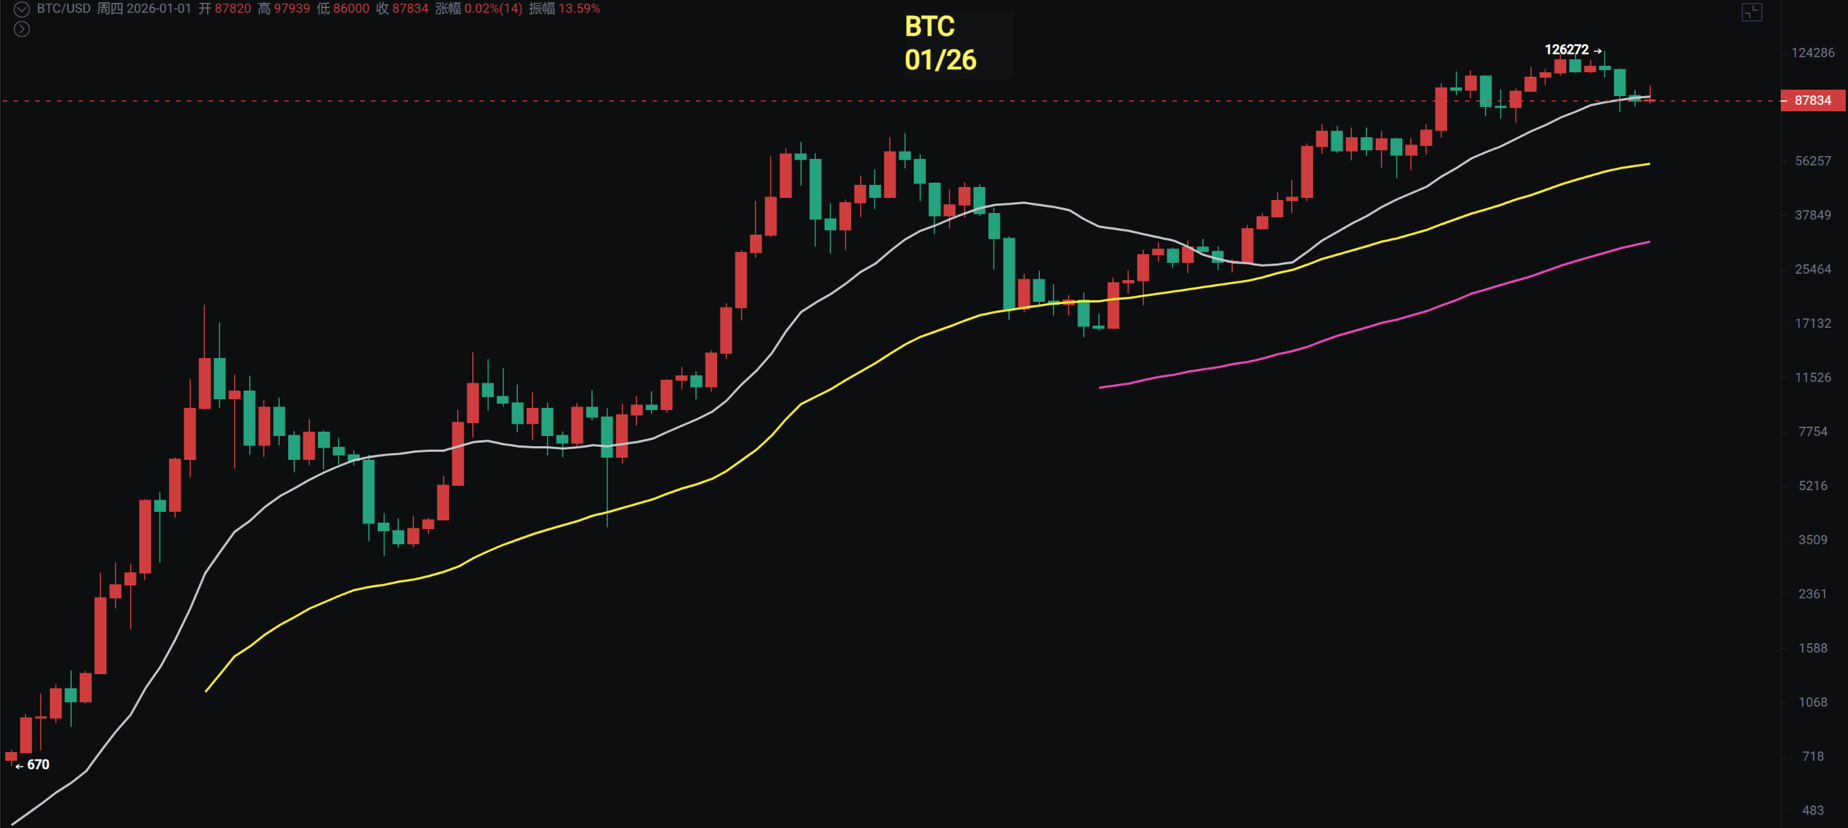
Bitcoin ETF
1. The listing price in January 2024 was 46k, after reaching 73k in 2024, it fluctuated for half a year, and then peaked at 124k in 2025.
2. In early 2026, it fell back to the range of 86k-97k, currently fluctuating around 87k-90k, and has not broken critical support.
3. On the funding side: the cumulative net inflow of the US spot Bitcoin ETF has exceeded 56.5 billion, with a slight net outflow recently followed by a rebound, and institutions are still continuously accumulating.
Summary: Overall, it is still biased towards bearish, but the protagonist believes the decline will not be too large, leaning towards maintaining high-level fluctuations. The depth of the current decline is unpredictable (PS: the view on the super cycle still needs further investigation and analysis).$BTC $ETH $SOL #ETH走势分析 #美股七巨头财报 #开源AI助理Clawdbot爆火硅谷