
When looking at the long-term time frame, especially the monthly chart, there is a pattern that consistently helps identify the major trend of Bitcoin: the 4-year cycle. This is a long-term indicator that has been monitored over the years and to this day, it has never deviated in the history of BTC's movements.
How does the 4-year cycle of Bitcoin operate?
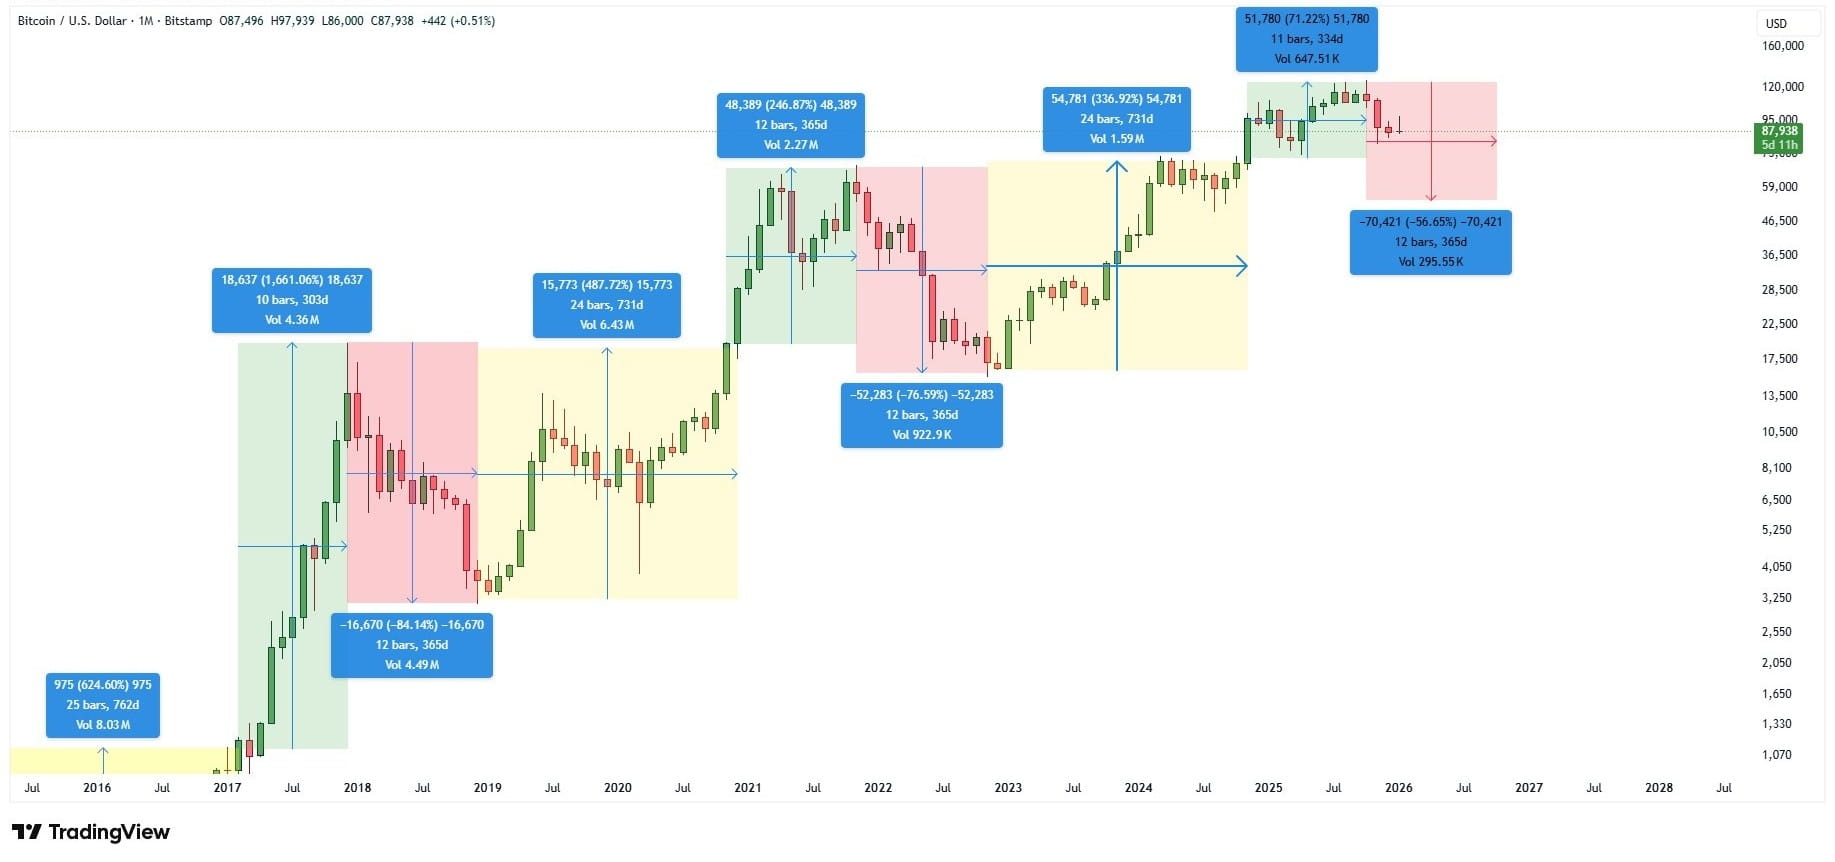
Since 2013, Bitcoin has gone through 3 complete market cycles, each cycle repeating the same basic structure:
About 2 years of stable growth, the market rises steadily
Next is a year of bullrun, where prices rise sharply and create peaks
Finally, it is a year of bear market, a phase of adjustment and revaluation
This pattern has been repeated many times and always clearly shows on the monthly chart.
Where are we in the current cycle?
According to the structure above, the bullrun phase of this cycle ended in October 2025, at the peak region. From that point on, the market entered the bear market phase, and according to the cycle logic, this phase could last until around October 2026.
If we continue to compare with previous cycles, the price target in the bear market is estimated around $50,000 by the end of 2026.
During the adjustment process, the market does not necessarily have to go straight down. A reasonable scenario is that Bitcoin $BTC may fluctuate around the $80,000 region for a period of time, before continuing to drop deeper towards the lower target region of the cycle.

Long-term perspective
The 4-year cycle is still operating exactly as it has in the past. For long-term market followers, this is a fundamental indicator that helps position Bitcoin $BTC throughout the entire cycle, instead of being swept away by short-term fluctuations.