Bitcoin Dominance (BTC.D) is currently trading below a key resistance zone at 60.35% (0.618 Fibonacci) — a level that historically decides whether capital flows into Bitcoin or rotates toward altcoins.
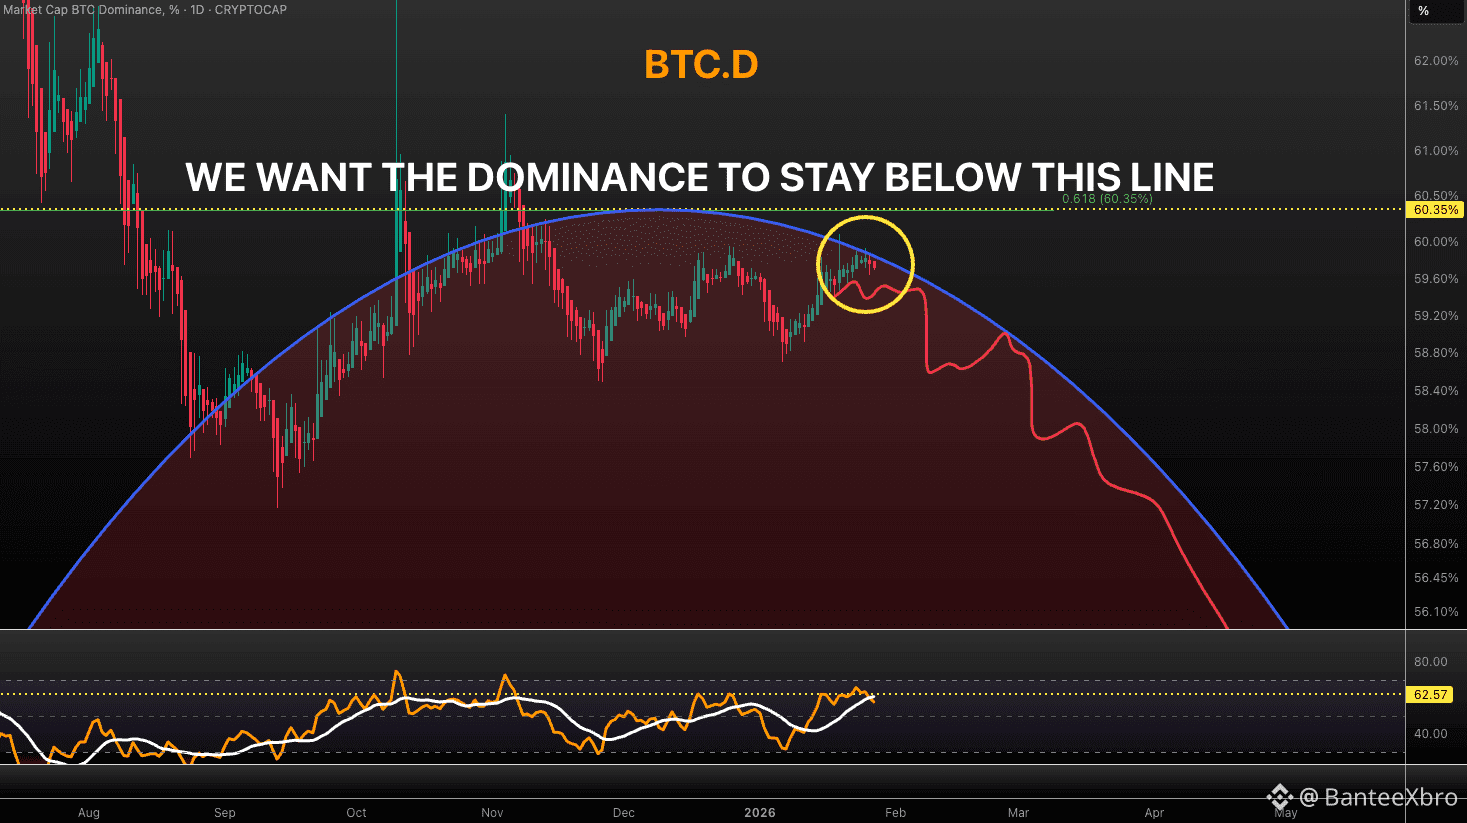
📉 The chart is forming a Rounded Top structure, signaling distribution rather than continuation. Multiple attempts to reclaim higher dominance have failed, with the most recent push facing a clear rejection, confirming weakening momentum.
🔍 Adding to this, RSI remains elevated but lacks bullish strength, suggesting BTC dominance is struggling to sustain upside pressure.
🧠 Market Implication:
As long as BTC.D stays below 60.35%, the broader crypto market favors:
🔄 Capital rotation into Ethereum
🚀 Strength across mid & low-cap altcoins
🌱 Early phases of a potential Altcoin Expansion Cycle
📌 A sustained breakdown in BTC dominance could open the door for strong relative performance in alts, while Bitcoin consolidates.
$BTC 👇👇

⚠️ However, a decisive reclaim above 60.35% would invalidate this scenario and shift momentum back toward Bitcoin dominance.
🔑 Conclusion:
BTC Dominance is at a critical inflection point — what happens next may define the next major market trend.
#StrategyBTCPurchase #btcupdates #Market_Update #BTCDOMINACE