
 #Sui #SUIUSDT #FedWatch #VIRBNB
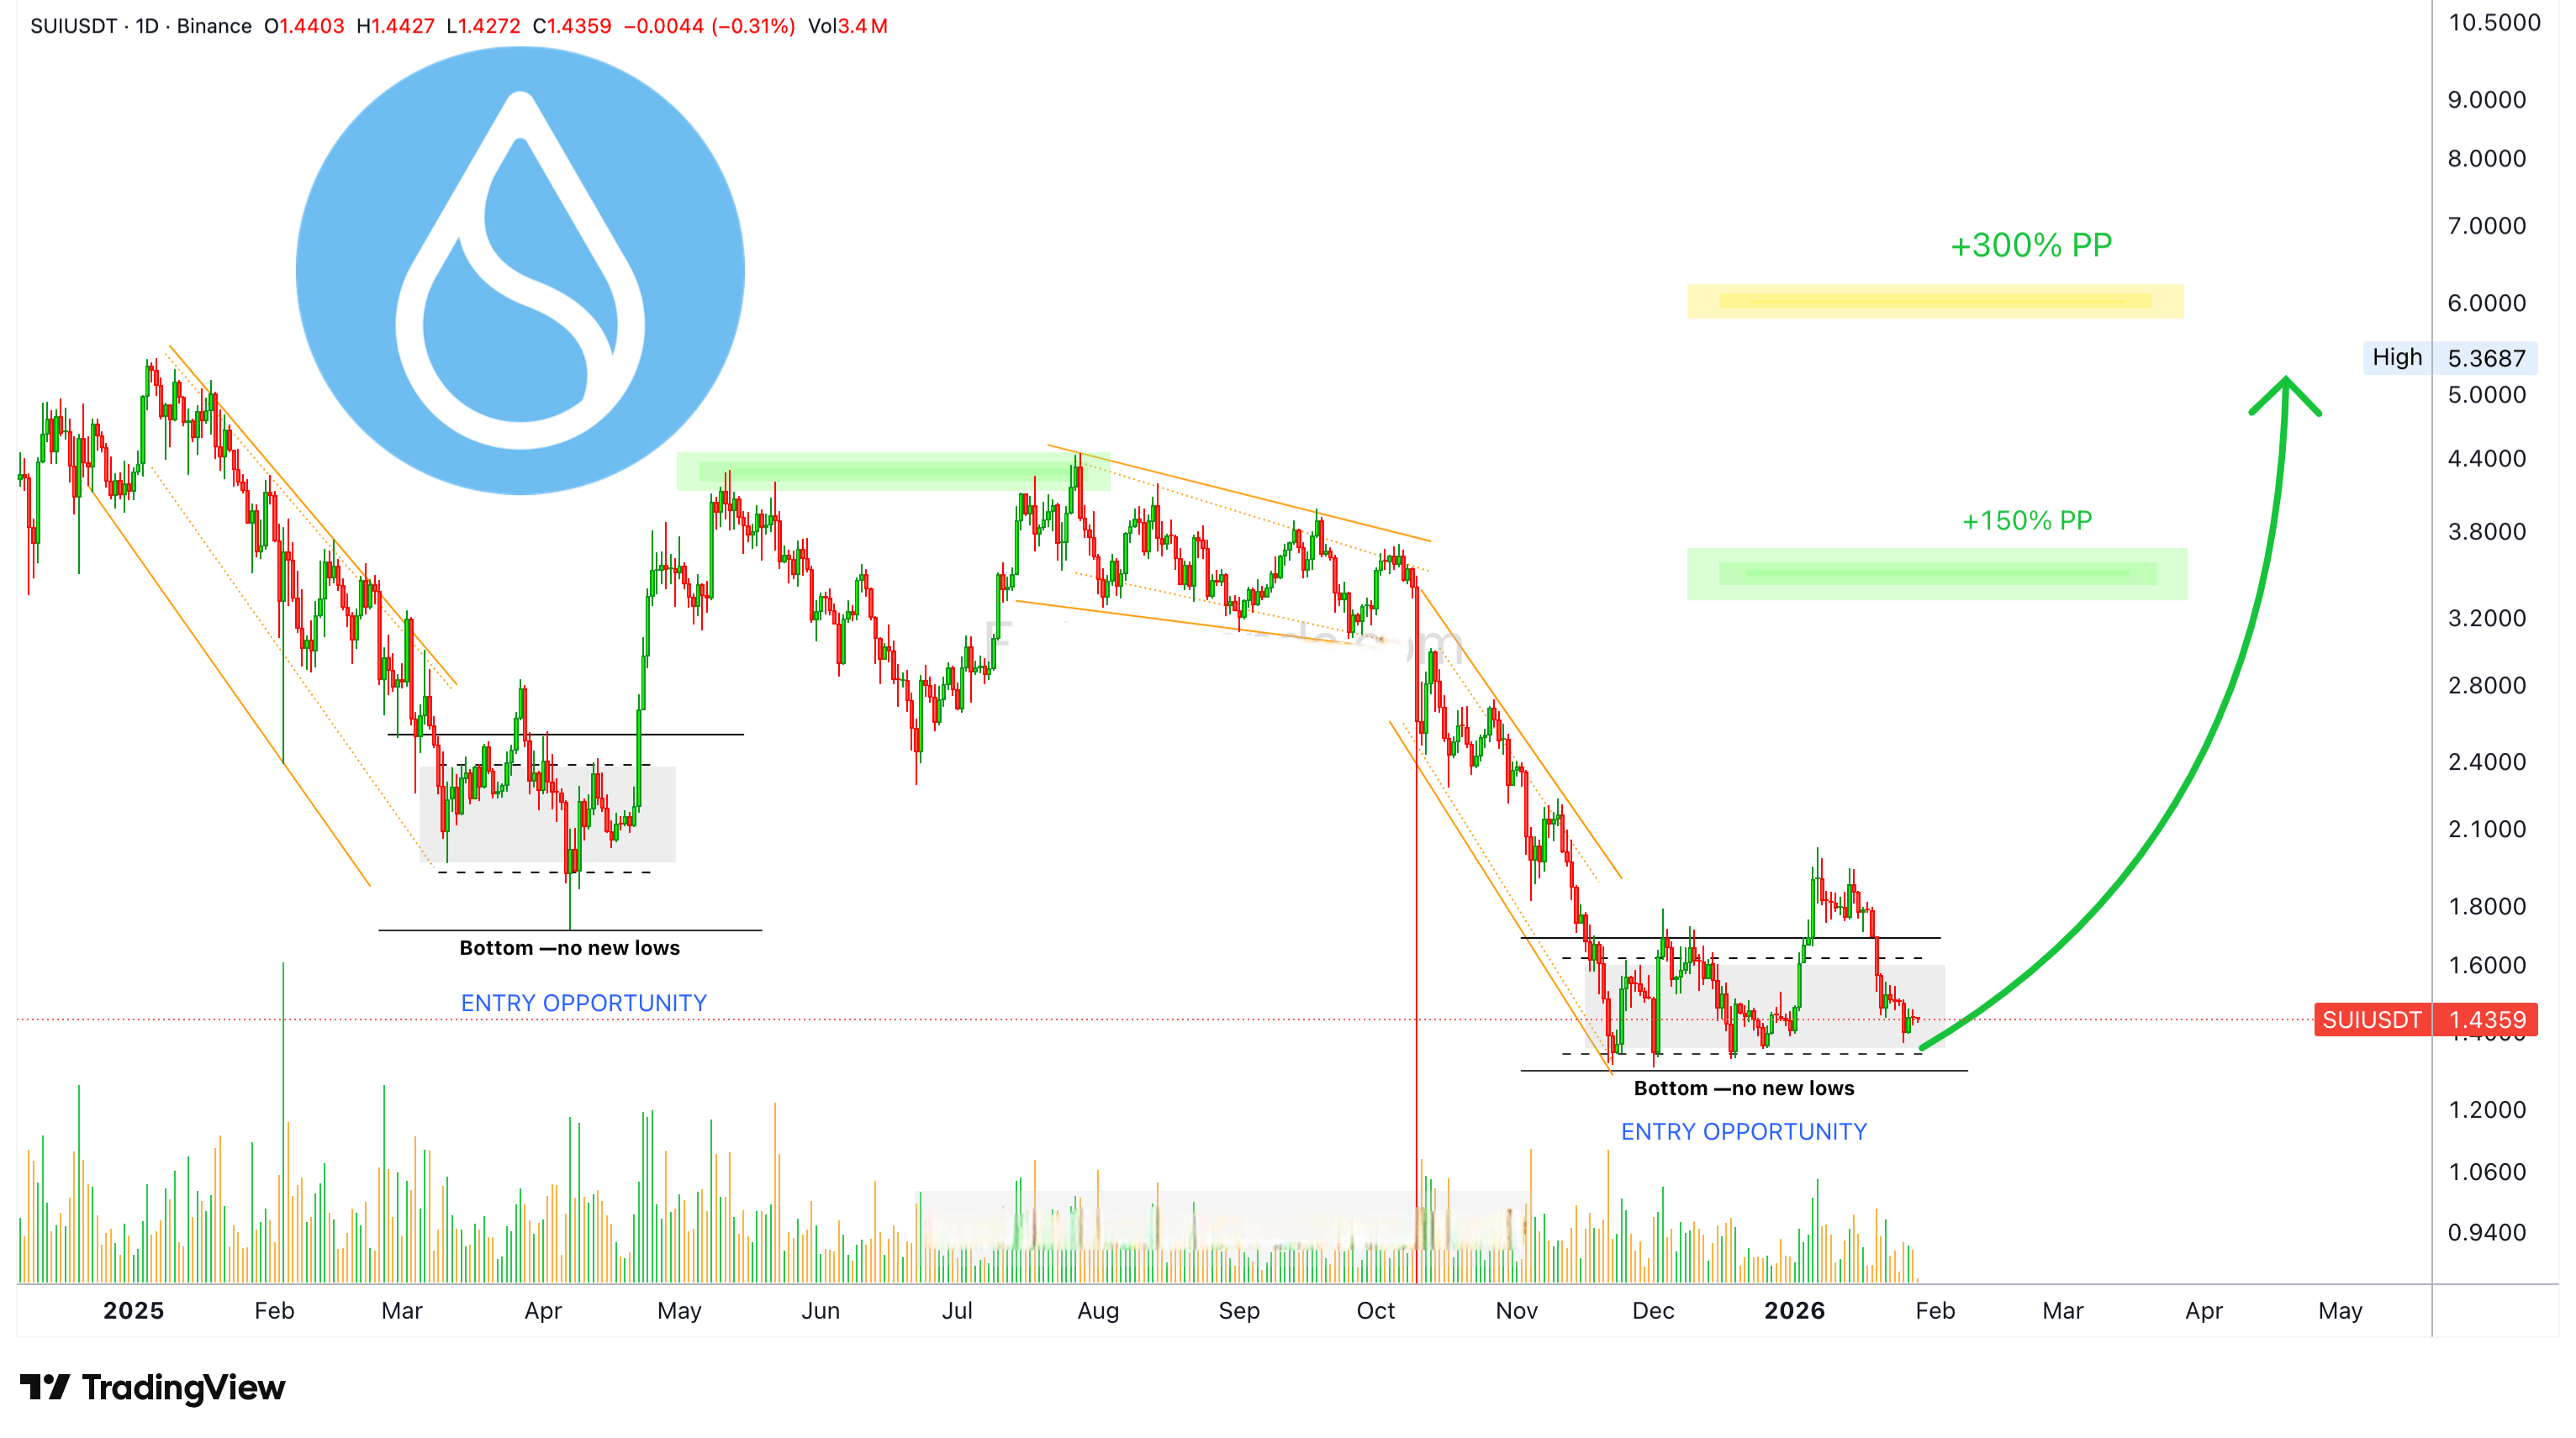
The situation here is the same as we have seen with all other major projects. SUIUSDT has returned to the buying opportunity zone as part of a correction, but the movement occurs as higher lows. This chart is very similar to Bitcoin in the short term.
We have higher highs and higher lows after the end of the previous bearish cycle; however, all of this is happening at low prices. There is no recovery yet.
This chart has very strong bullish potential because the movement occurs at support and there is no bearish trend anymore. No new lows while Sui is trying to pull itself from a major bottom.
The bearish conditions would lead to the lowest drop on January 25 compared to December 1 instead of the lowest high.
The correction began on January 6. SUIUSDT reached a peak of $2.02. The total duration of this correction so far is 19 days, assuming January 25 is the end. This is a long time for a correction, especially when considering that the initial upward breakout lasted only 19 days. The duration is the same.
Why should the correction last longer than the rise?
The first rise only lasted 11 days. Either something is missing or the market is very bearish. We will take both into account.
The market is very bearish and we are missing the reverse market reaction, a bullish jump.
Market sentiment is still scary, it hasn't been green since May 2025. A long time ago.
Okay. Will Sui move higher? What does the chart say?
HYPEUSDT started growing last year exactly after April 7, and went on to produce a massive upward wave. Currently, HYPEUSDT is starting to grow really strong (see here), Sui might do the same.
This chart supports a very strong growth wave. Everything points to higher prices, but you need a sharp eye, a mind, and a lot of experience to be able to reach this conclusion. Time will tell us. If you are right, it shouldn't take long.
We are rising.
Namaste.
✅ Trading here at $SUI