
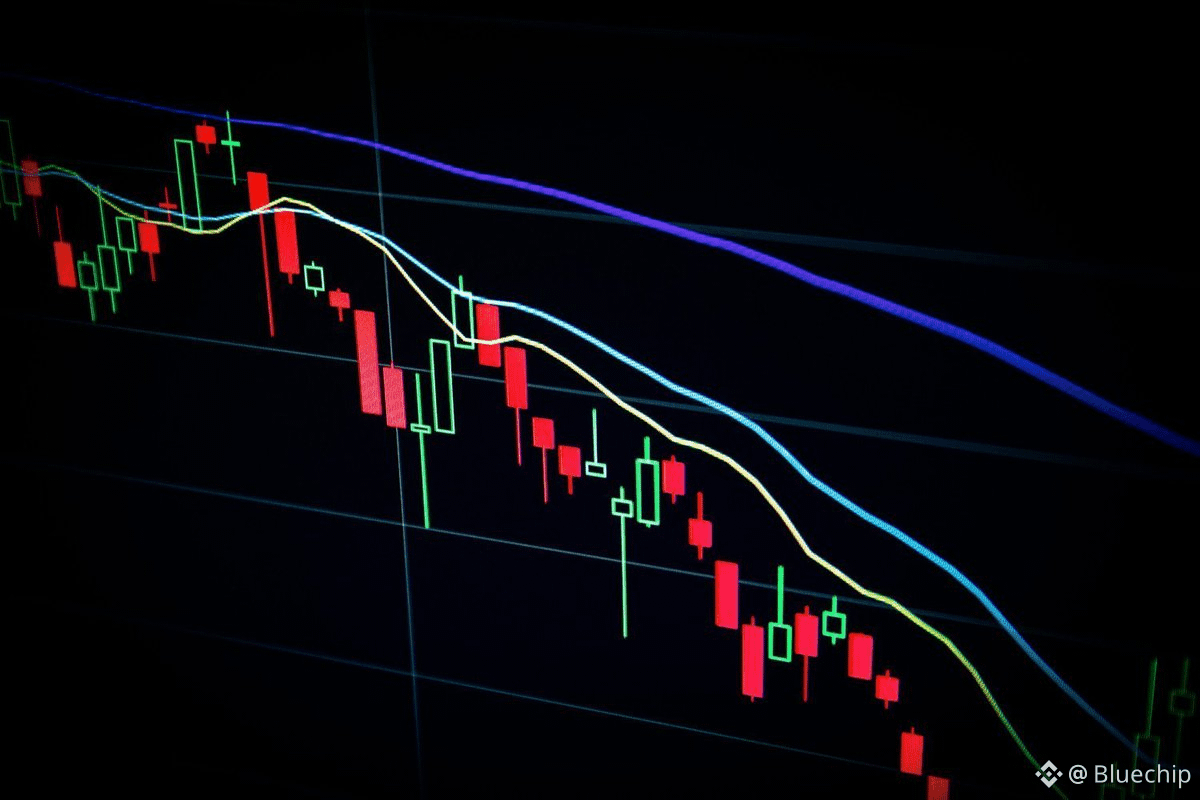
1. MACD
2. RSI
3. Fibonacci Levels
(1/15)
1. MACD
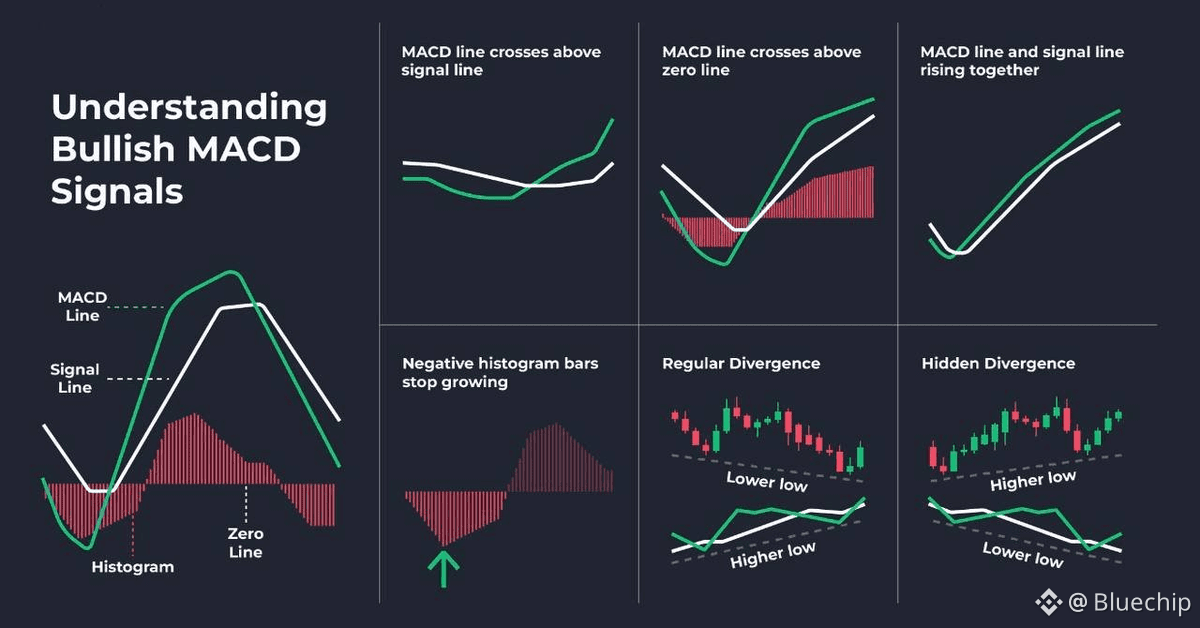
MACD is a trend-following indicator that compares two EMAs to show trend direction and momentum shifts.
Crossovers and divergences can hint at future moves.
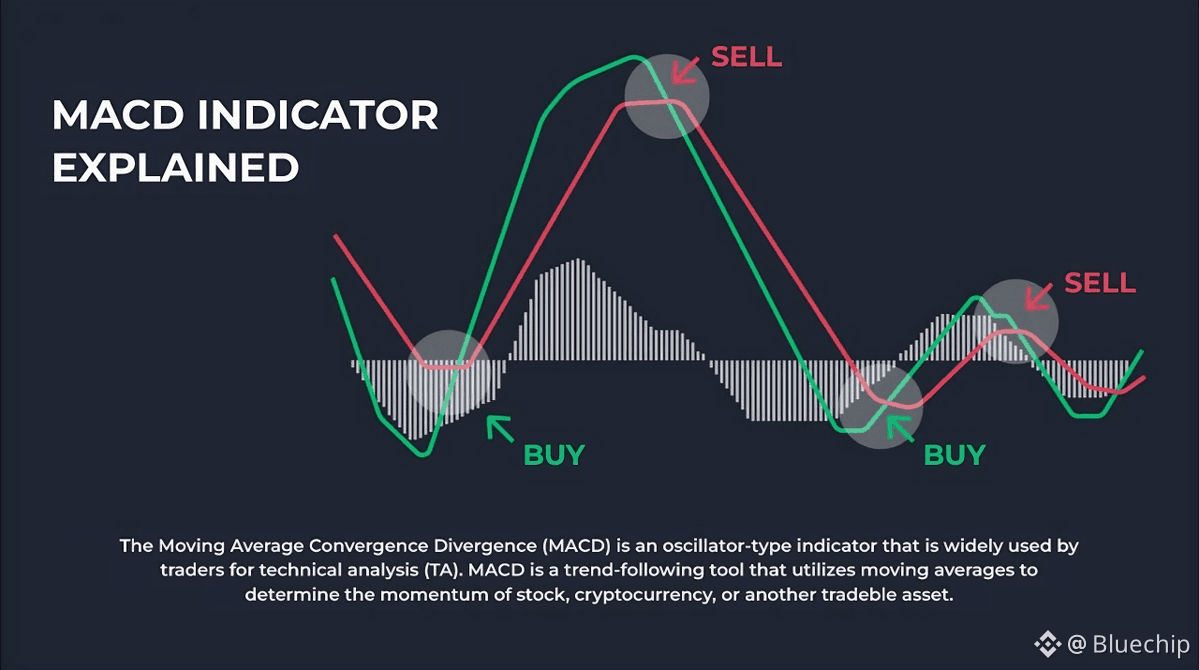
1.1 MACD
MACD usually moves in the same direction as price.
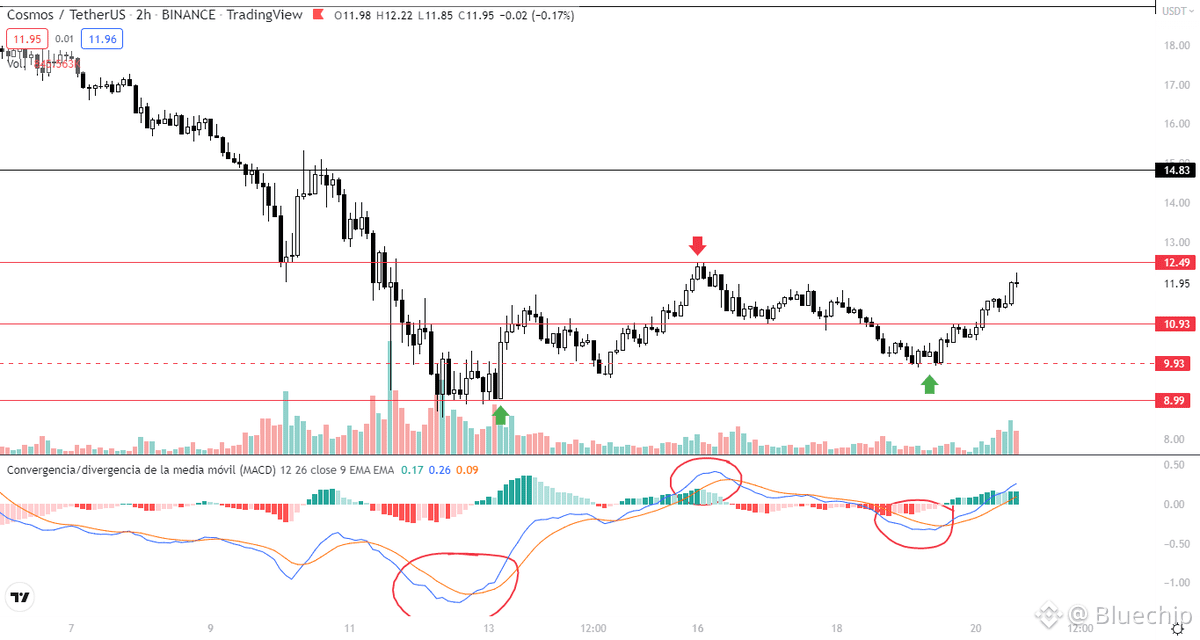
A divergence happens when price and MACD move in opposite directions.
This can signal a potential trend change.
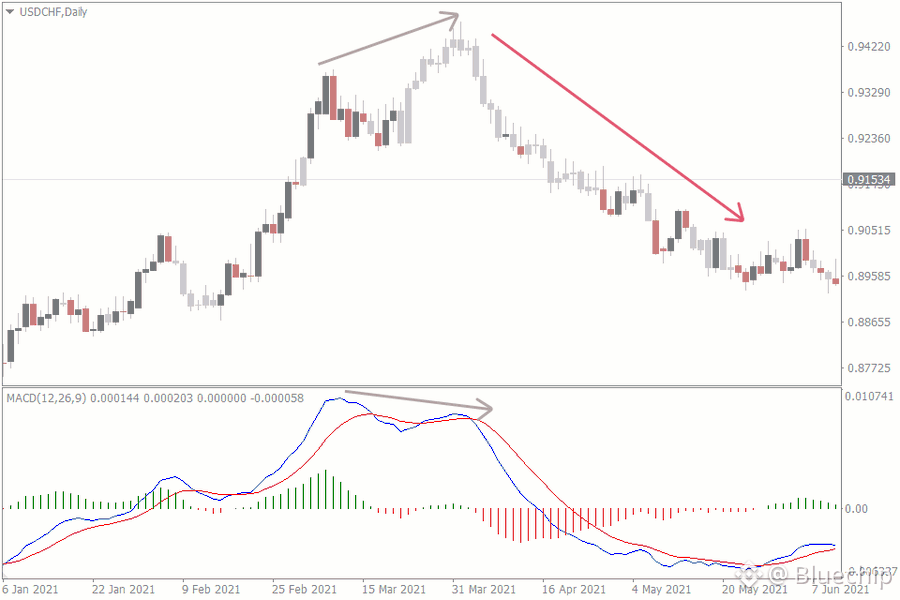
1.2 MACD
The MACD zero line shows momentum direction:
Readings above zero indicate bullish momentum.
Readings below zero indicate bearish momentum.
1.3 MACD
When the crossing of the MACD line with the Signal line occurs from the bottom up, the trend will be BULLISH.
When the crossing of the MACD line with the Signal line occurs from top to bottom, the trend will be BEARISH.
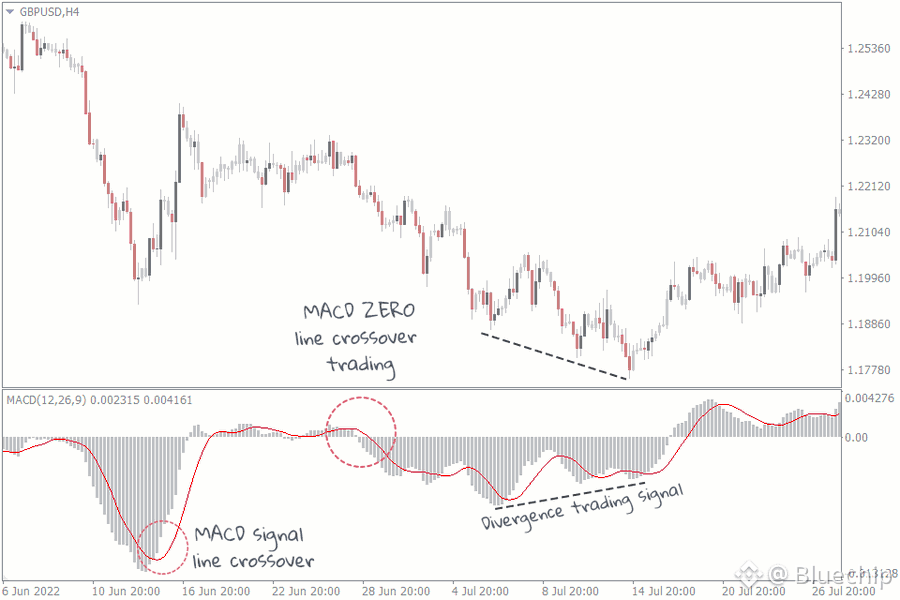
1.4 MACD
A bullish divergence appears when MACD forms two rising lows that correspond with two falling lows on the price.
In this image there are more bullish divergences explained.
1.5 MACD
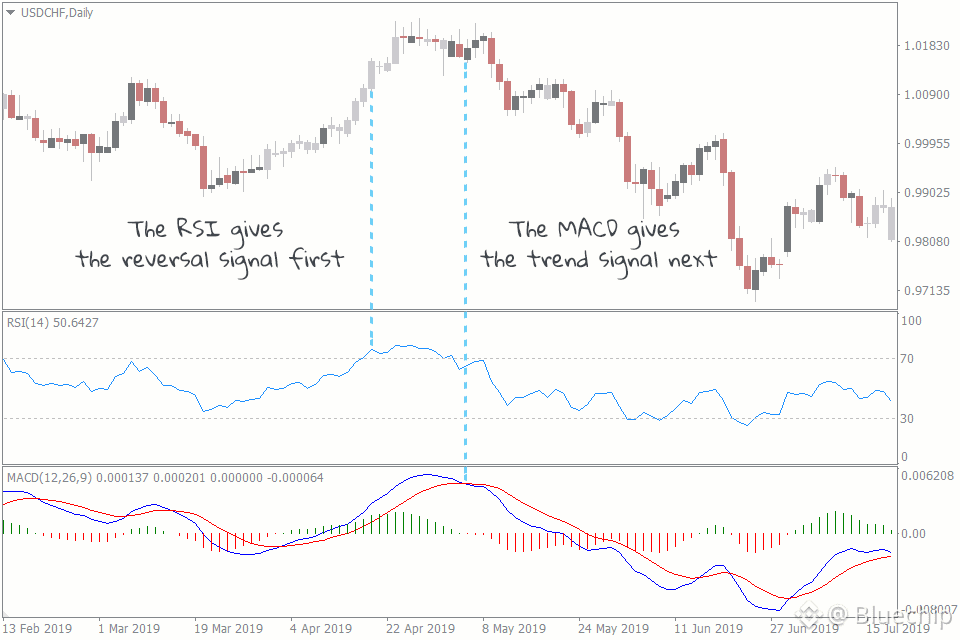
MACD vs RSI:
MACD uses exponential moving averages and performs best in trending markets, measuring momentum and trend direction.
RSI is based on recent highs and lows, making it effective for spotting overbought/oversold conditions and potential reversals.
2. RSI
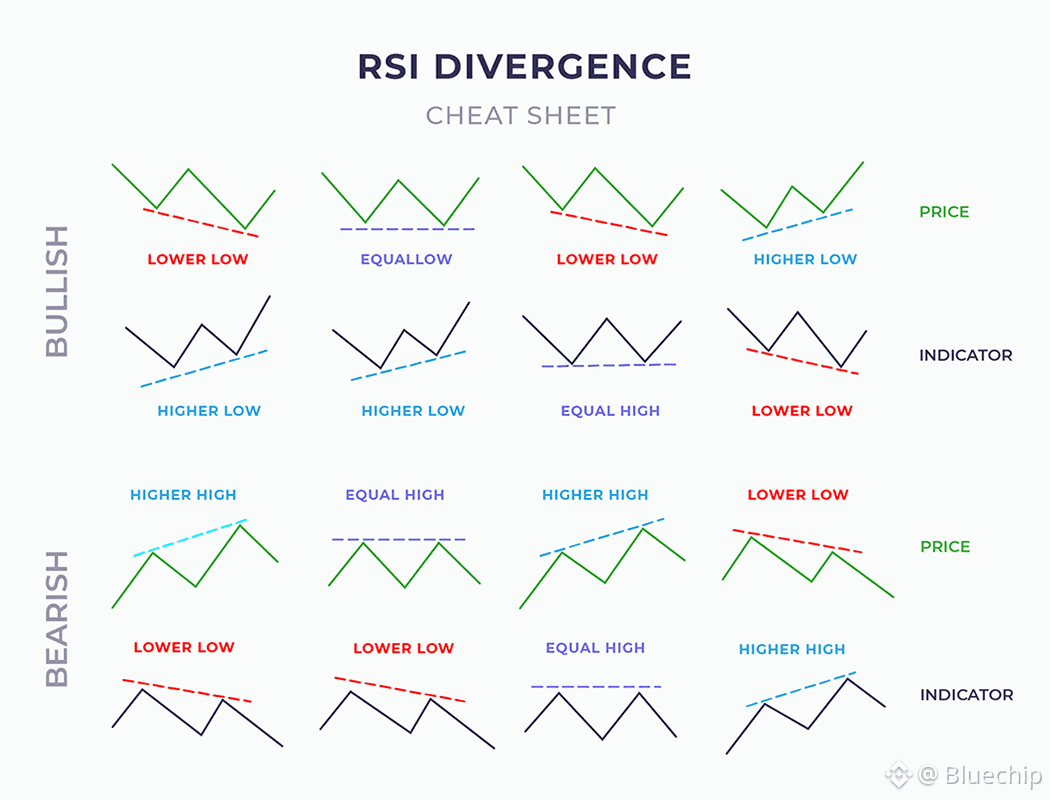
A bullish divergence occurs when price makes a lower low while the indicator forms a higher low
A bearish divergence occurs when price makes a higher high while the RSI forms a lower high
2.1 RSI
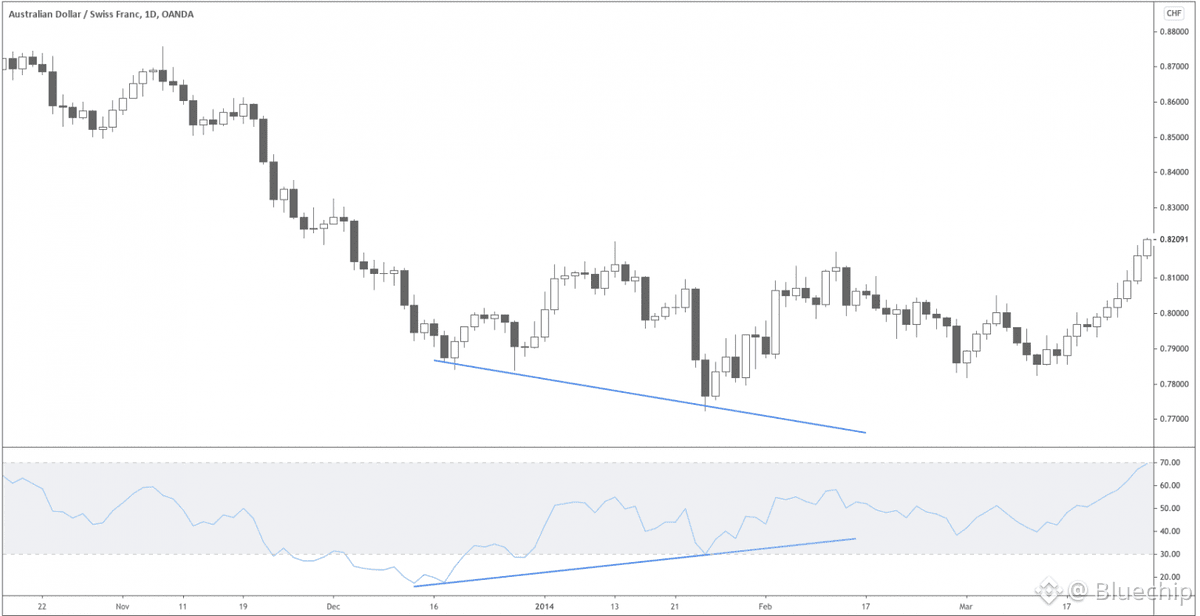
Bullish RSI divergence occurs when price forms lower lows while the RSI forms higher lows.
Confirm the move with volume or other momentum indicators.
2.2 RSI
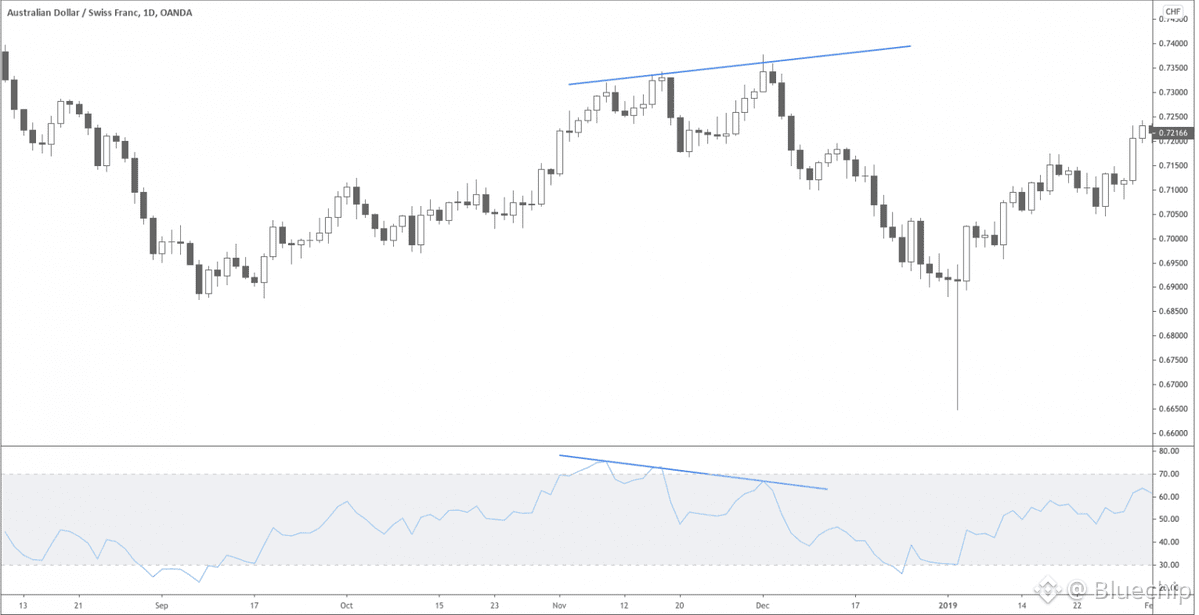
Bearish RSI divergence appears when price reaches a higher high but the RSI forms a lower high.
2.3 RSI
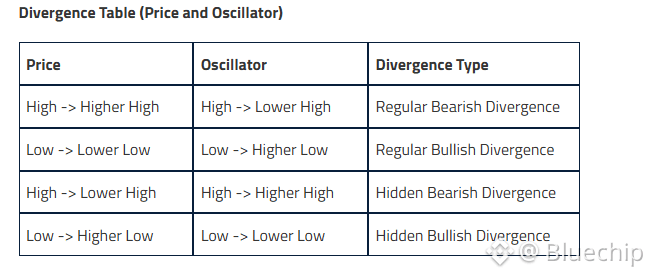
There are 4 types of Divergence:
- Regular Bullish Divergence
- Regular Bearish Divergence
- Hidden Bullish Divergence
- Hidden Bearish Divergence
Which are broadly classified into two categories:
- Regular/Classic Divergence
- Hidden Divergence
3. Fibonacci Levels
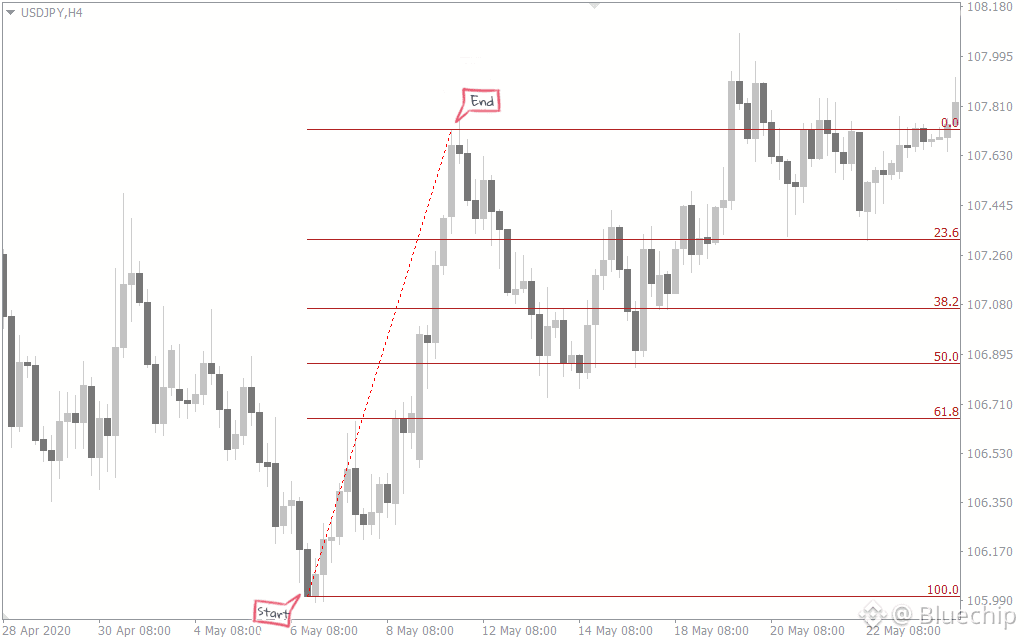
How to set up Fibonacci Retracement in an Uptrend:
In an uptrend, place the Fibonacci tool at the trend’s lowest point, then drag it to the highest point.
This maps key support levels where price may pull back before continuing upward.
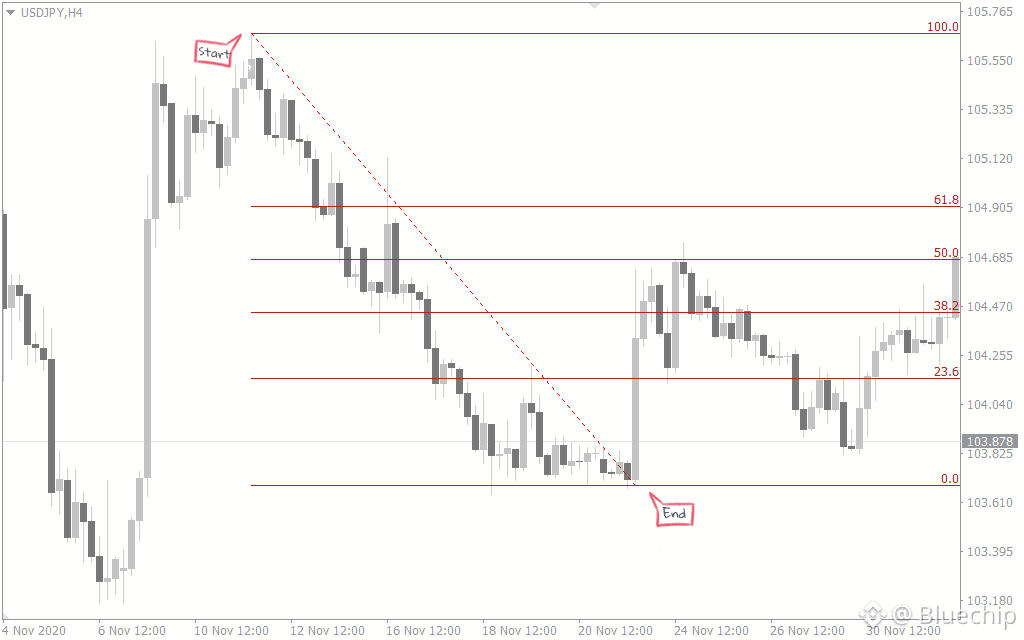
3.1 Fibonacci Levels
How to draw Fibonacci Retracement in a Downtrend:
In a downtrend, place the Fibonacci tool at the trend’s highest point and drag it to the lowest point.
This highlights key resistance levels where price may retrace before continuing downward.
3.2 Fibonacci Levels
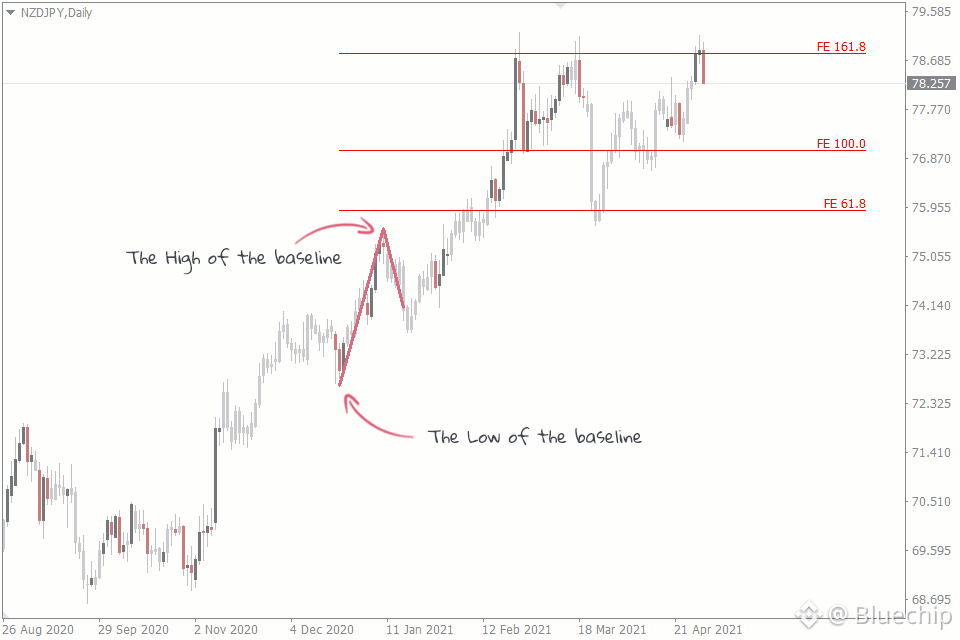
The Fibonacci Expansion:
Projects where price may move in the trend’s direction.
In an uptrend, it estimates the potential next peak before the price reaches it.
3.3 Fibonacci Levels
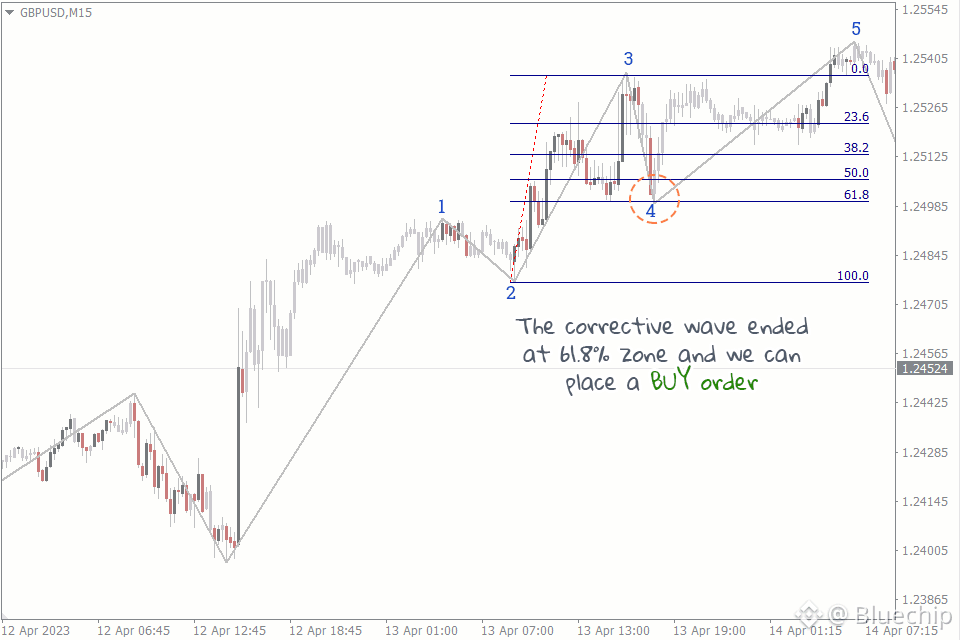
Elliott Wave traders use Fibonacci levels to identify potential target zones and reversal points.
Key levels to watch: 38.2%, 50%, 61.8%, 100%
By: Cryptosoulz