Good morning! Welcome to Day 32.
This is a pivotal lesson. Up until now, you've been looking at charts on one timeframe—maybe the 15-minute for quick moves or the daily for the big picture. Today, you'll learn how to layer them together to make smarter, calmer decisions.
This method is called Timeframe Stacking or Multiple Timeframe Analysis. It’s the secret to seeing the full story and filtering out distracting "noise."
---
The Simple Analogy: Planning a Road Trip
Imagine you're driving cross-country.
1. The Big Map (Higher Timeframe - HTF):
You check a country map (like the weekly or daily chart). This shows you the major trend: are you going generally Northeast? This is your overall direction.
2. The City Map (Lower Timeframe - LTF):
Then you zoom into a city street map (like the 1-hour or 15-minute chart). This helps you find the exact on-ramp to the highway without hitting traffic lights. This is your entry.
Using only the city map, you might miss that you're driving toward a mountain range. Using only the country map, you’ll struggle to find the next gas station. You need both.
---
The 3-Step Stacking Method
Here’s how to apply it, step-by-step:
Step 1: Find the Major Trend (HTF)
· Go to the Daily (1D) or Weekly (1W) chart. Are the main candles mostly green and making higher highs? That's an uptrend. Mostly red with lower lows? Downtrend.
· Golden Rule: Trade in the direction of the HTF trend. It’s easier to swim with the current.

Step 2: Find Your EntZone (LTF)
· Zoom into a lower timeframe, like the 4-Hour (4H) or 1-Hour (1H) chart.
· Look for your entry signal (like a bullish candlestick pattern from Day 29, or a support level holding) that aligns with the HTF trend.
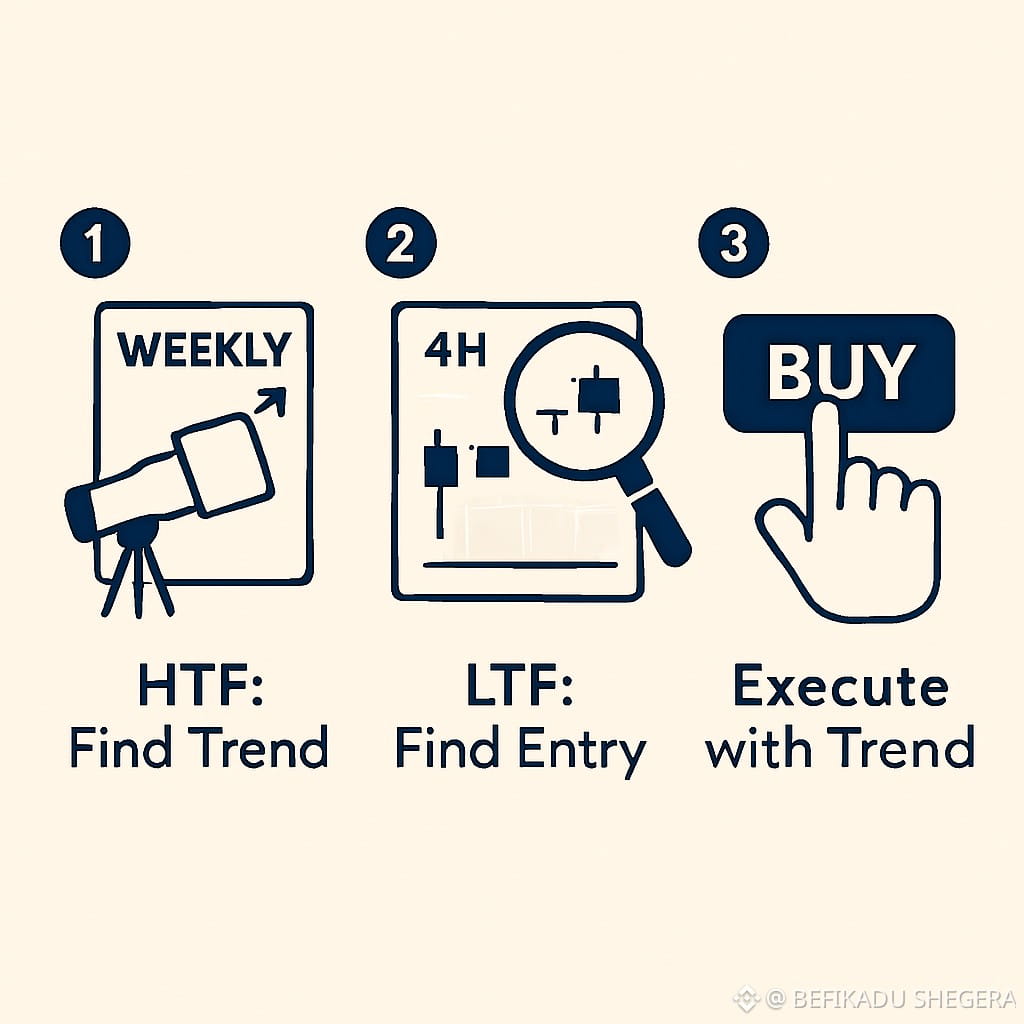
Step 3: Execute and Manage on LTF
· Place your buy order based on the LTF signal.
· Set your stop-loss just below the LTF support level that triggered your entry.
---
Real Example: Buying in an Uptrend
· HTF (Daily Chart):
Shows a clear uptrend. Your bias is BUY/ LONG.
· LTF (4-Hour Chart):
Price pulls back to a key support level and forms a bullish hammer candle.
· Action:
You enter the buy at the LTF support, with your stop-loss below it. You're buying a dip within a larger uptrend.
What This Solves: Noise vs. Signal
Staring at a 5-minute chart, every little wiggle looks huge and urgent—that's noise. It causes emotional, reactive trading.
The HTF (daily chart) shows the true signal—the sustained direction. This keeps you patient and aligned with the stronger force.
---
Today’s Big Takeaway
Stop looking at just one chart. Always start with the HTF trend, then use the LTF for precision.
This simple habit will:
✅ Improve your accuracy (trading with the trend).
✅ Dramatically reduce noise (ignoring scary small dips in a big uptrend).
✅ Build patience (waiting for the LTF to give you the perfect entry).
You’re no longer just reacting; you’re strategizing. This is a huge upgrade to your trading mindset.
Keep stacking those timeframes, and keep stacking your knowledge. You're evolving from a beginner into a strategist.
— Your Guide on the 90-Day Challenge ✨