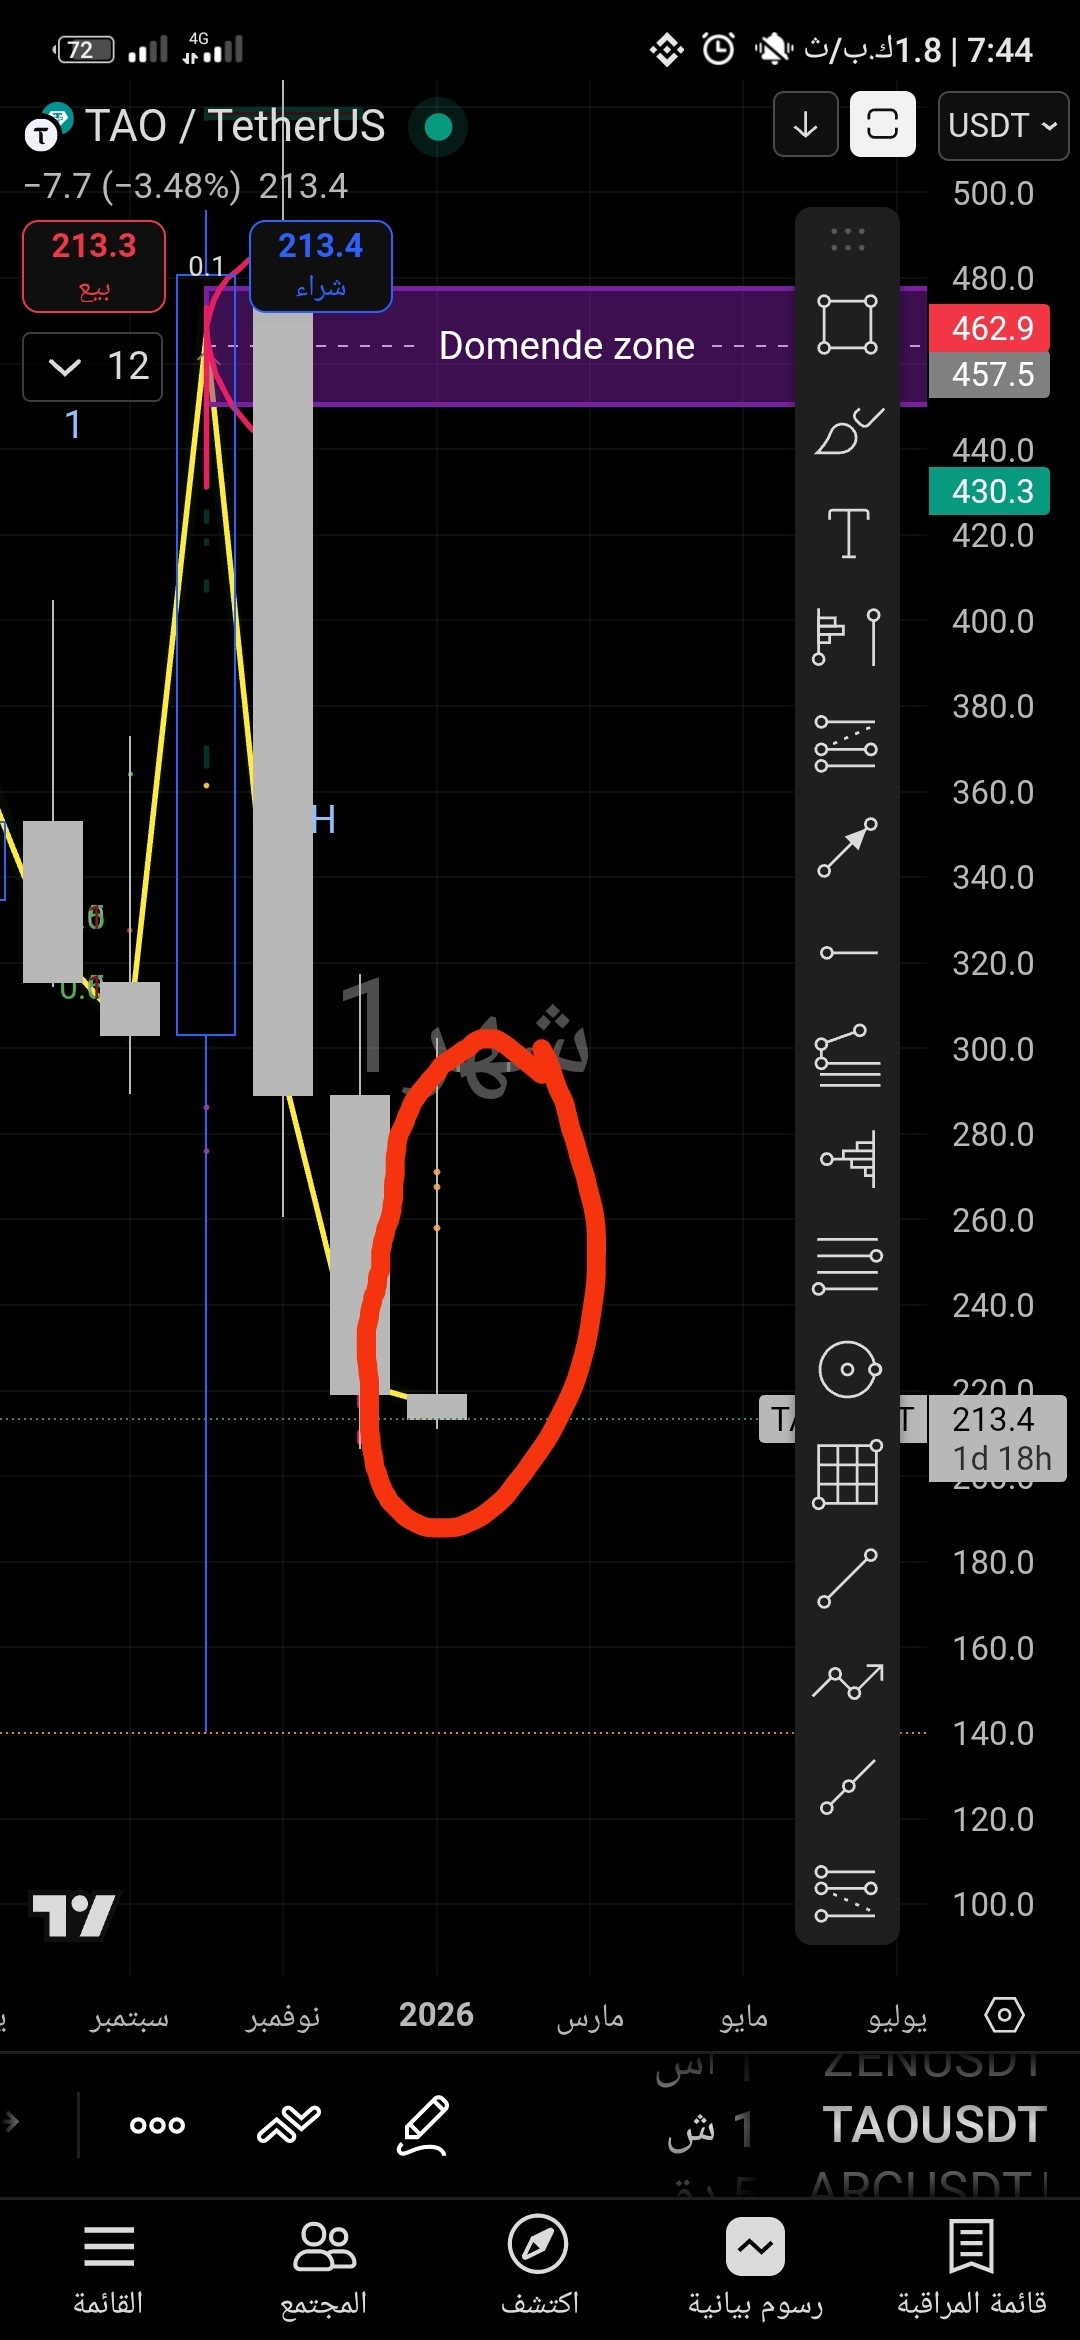
The last candle that did not break the previous monthly low means that sellers have lost their strength at this level, and selling pressure has begun to decrease. Its presence at a historical support makes it a potential reversal point, as sellers are likely to close their positions and exit, which opens the door for buyers to lead the upcoming movement.
🔹 The main point:
The market has performed a "liquidity pull" through the upper wick, to test the intentions of buyers and sellers.
Not breaking the bottom is a sign of strength, as it proves that there are buyers ready to defend this area.
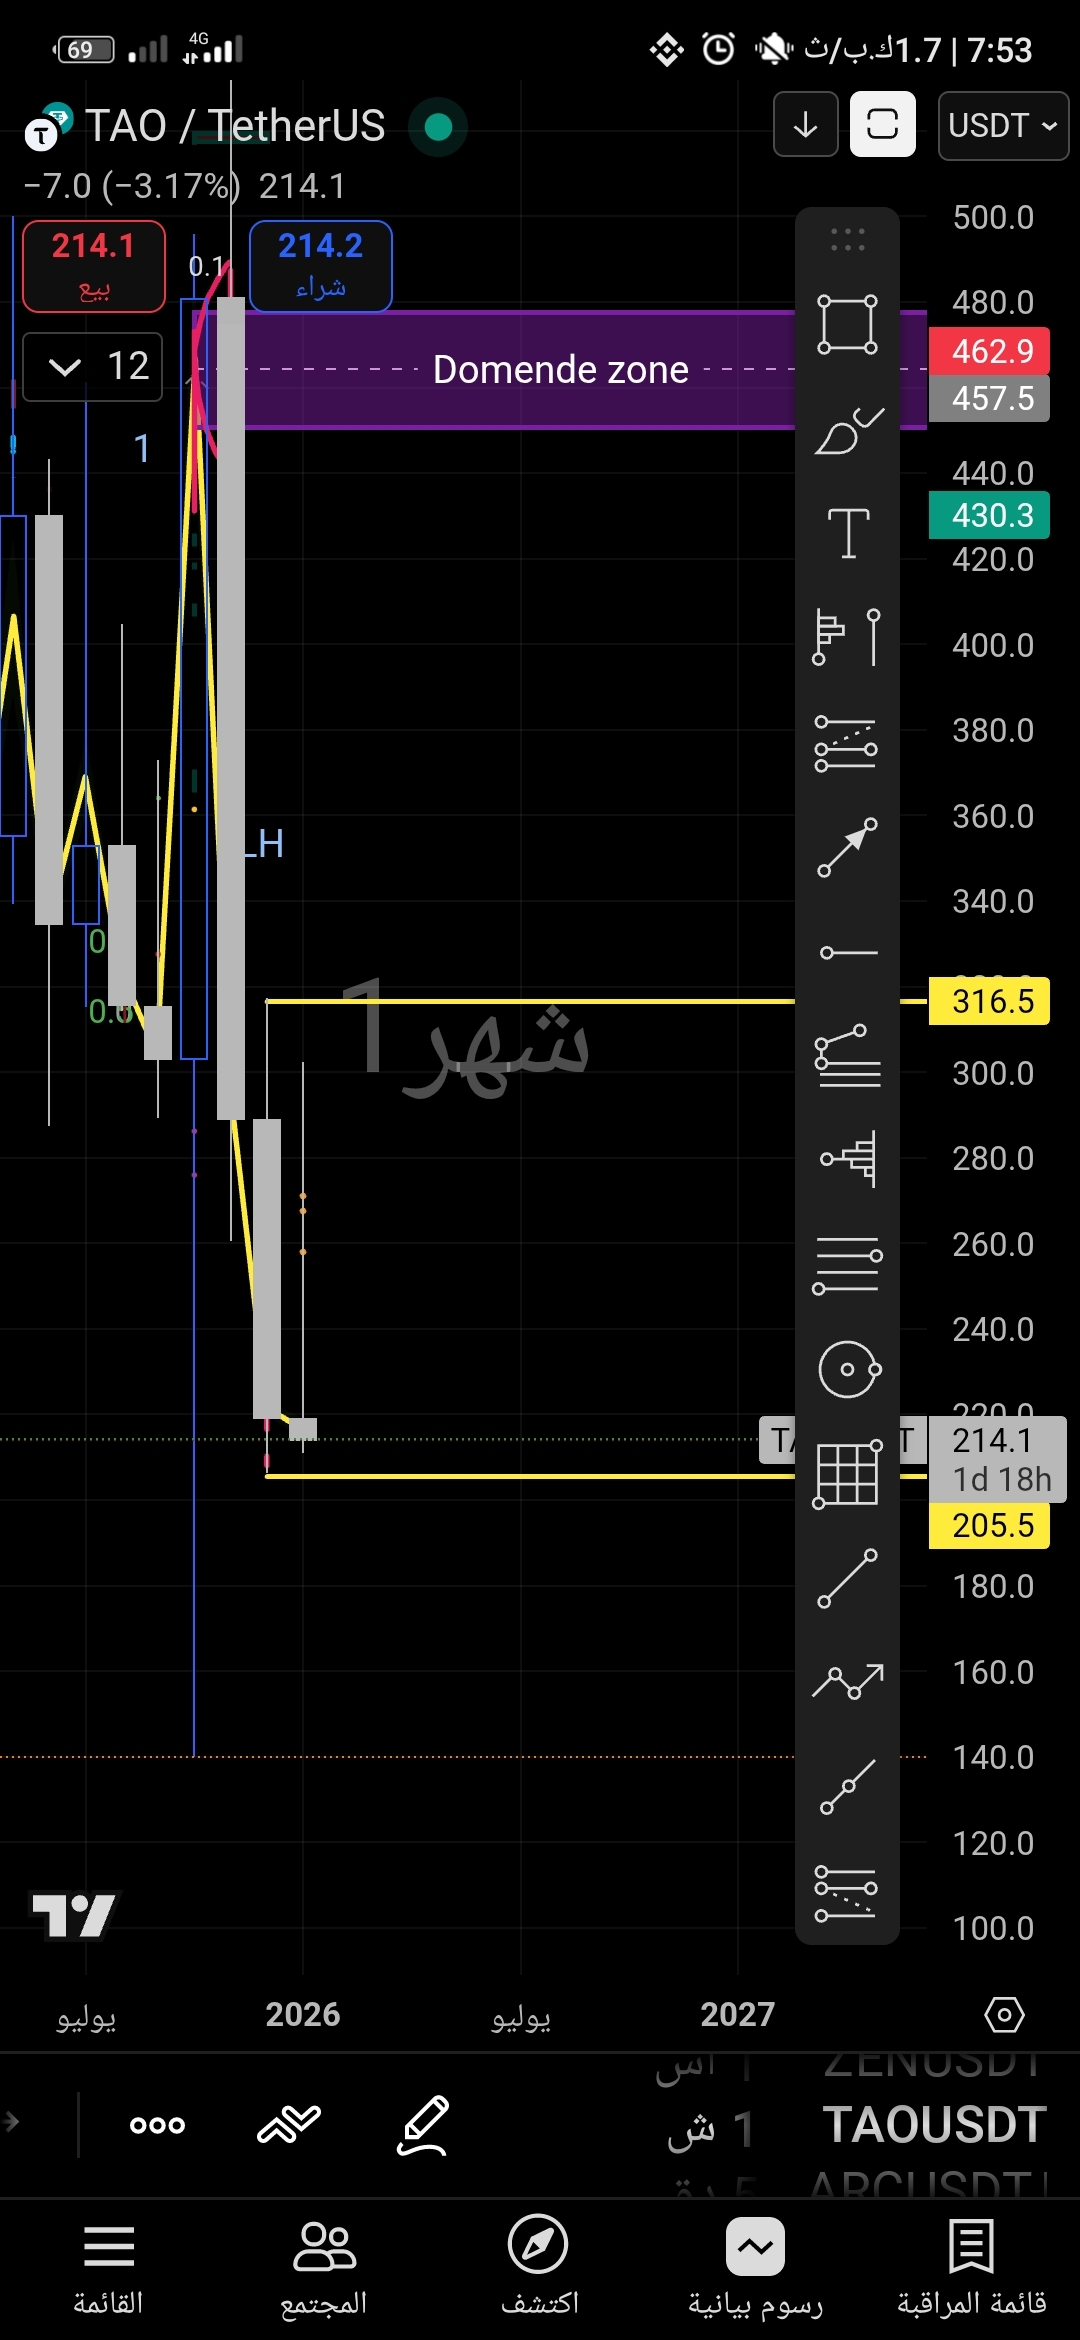
If the February candle comes strong and bullish, this will serve as confirmation that the path to higher levels (like 316 then 430) is open.
Inverted Hammer.
🕯️ The meaning of the inverted hammer in this context:
Usually appears after a downtrend.
The long upper wick means that buyers tried to push the price up, but the close remained near the bottom.
It is an initial signal that buyers are starting to show up, but it is not confirmation of a reversal unless followed by a strong bullish candle.
📈 What do we expect?
If the February candle comes strong and bullish (engulfing or marubozu), this will confirm that the inverted hammer was an early signal for a bullish reversal.
If no confirmation appears, it may just remain a failed attempt by buyers, and the fluctuation near support continues.
🔹 Summary:
The monthly trend is leaning towards bullishness, provided that confirmation appears in the next candle. Continuing down seems unlikely as long as support is not broken, thus the logical bias is to wait for a strong candle and join with the buyers.