A Technical Market Analysis The recent Bitcoin price action makes one thing very clear: this drop is not random it is structural.
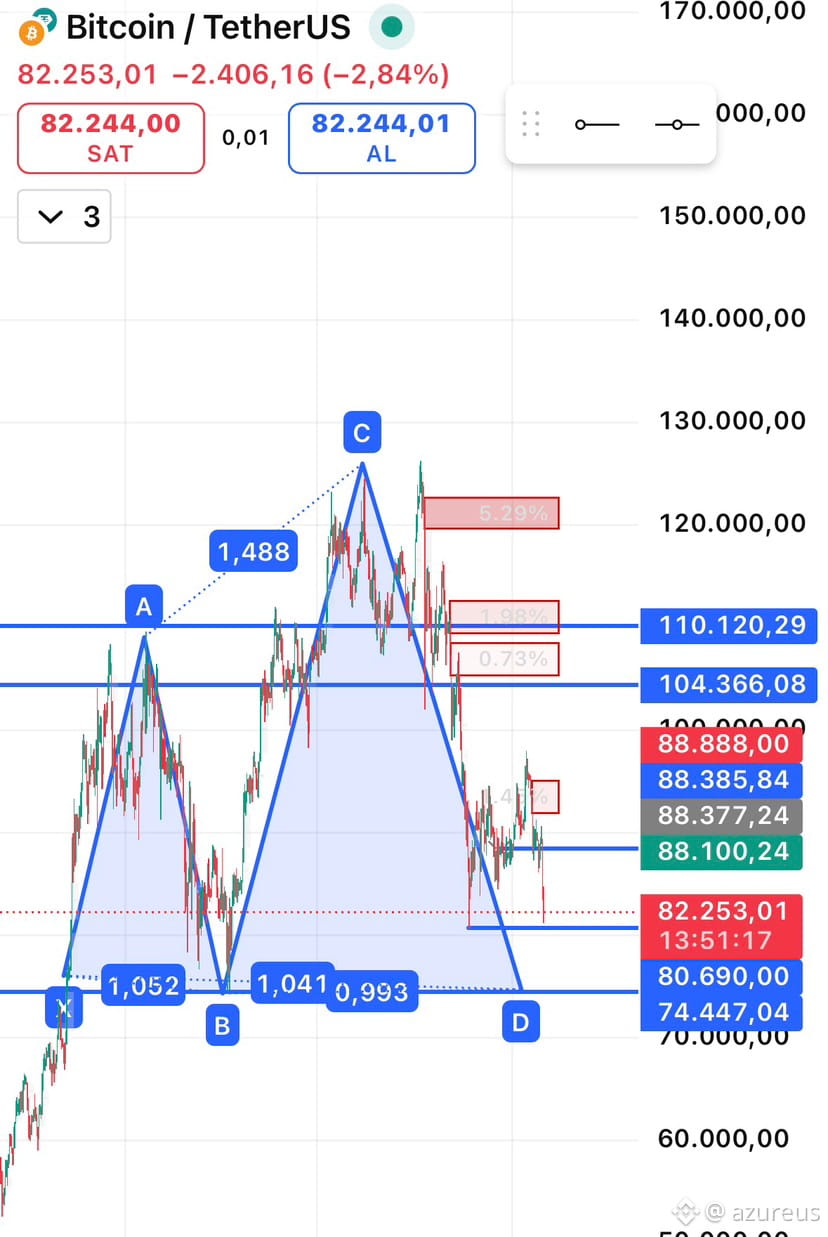
How Supports Were Invalidated
$BTC 110K → 104K → 88K
Each of these levels was once support, then completely failed.
What does that tell us?
Buyers did not defend Stop-loss clusters were flushed Liquidity was pulled lower
Once a level closes below, it is no longer support. It becomes a retest zone, not a buy zone.
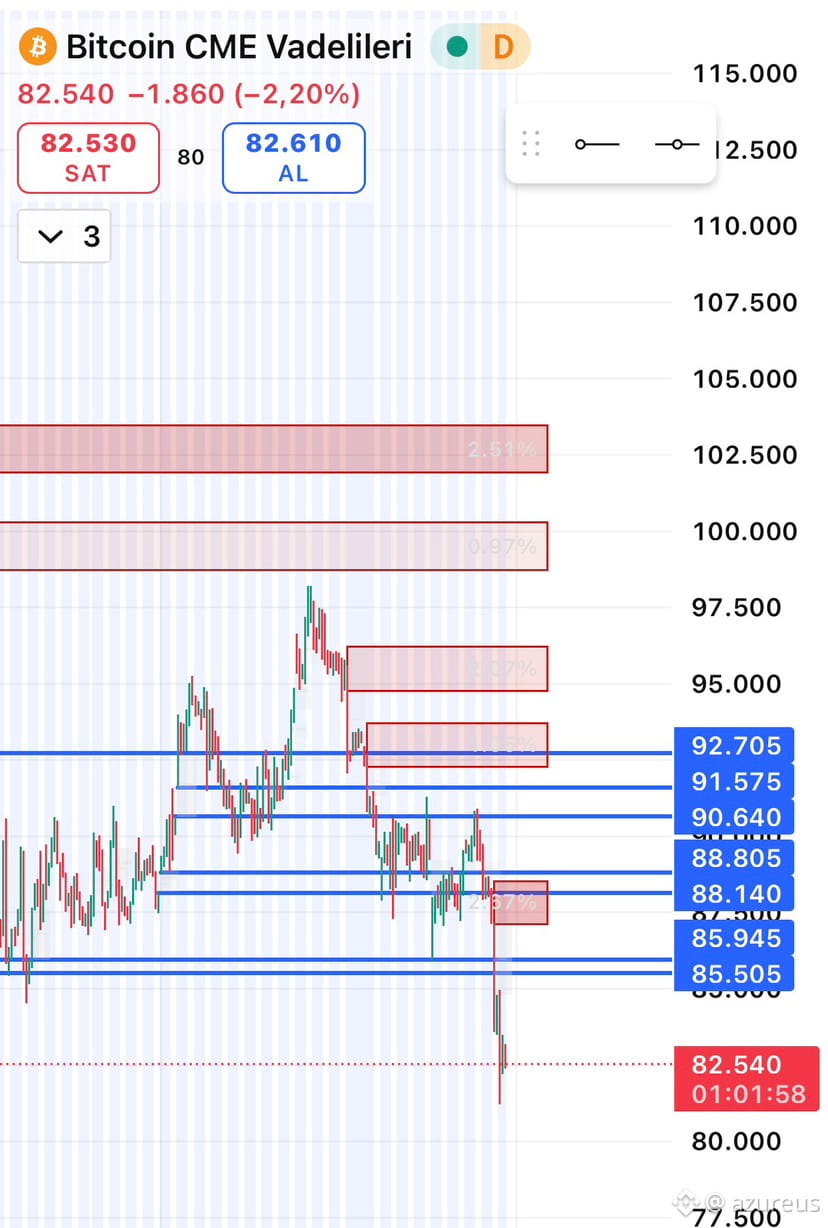
CME Futures: No Illusions
The second chart (CME Futures) is even more brutal:
• 92K – 91K – 90K all lost
• Below 88K is now accepted price
• Price is being drawn toward the 80–85K inefficiency zone
#cme is clear:
“Spot sells hope. Futures price reality.”
Gap behavior and impulsive candles confirm: This is not a bounce This is acceptance at lower levels
This #market : Rewards patience Punishes impulse Destroys traders who confuse hope with structure
#altcoins Are Not “Following Bitcoin” — They’re Being Exposed
A Market Reality Check
When Bitcoin breaks structure, altcoins don’t correct they get judged.
And most of them fail.
STAY SAFU