January has been a volatile month for cryptocurrency, with early month gains followed by a strong late-month sell-off. Some large tokens have wiped out gains accrued over weeks in just a few days. In this context of instability, cryptocurrency 'whales' in February are focusing on three assets showing early reversal signals.
On-chain data indicates increasing accumulation as selling pressure eases and bullish divergence patterns are forming or about to be confirmed. This suggests large wallets are preparing for selective recoveries rather than chasing short-term momentum.
Shiba Inu (SHIB)
Shiba Inu is one of the more surprising names showing whale activity as we enter February. Although January was weak for most altcoins, SHIB has increased by about 3.3% over the past 30 days, making it one of the few large tokens to end the month in the green.
This relative strength is currently supported by large holders.
Since January 27, whales have increased their holdings from 666.05 trillion SHIB to 666.74 trillion SHIB, adding 690 billion SHIB, indicating stable positioning during a weak market period. This accumulation moment is closely related to an important technical signal.
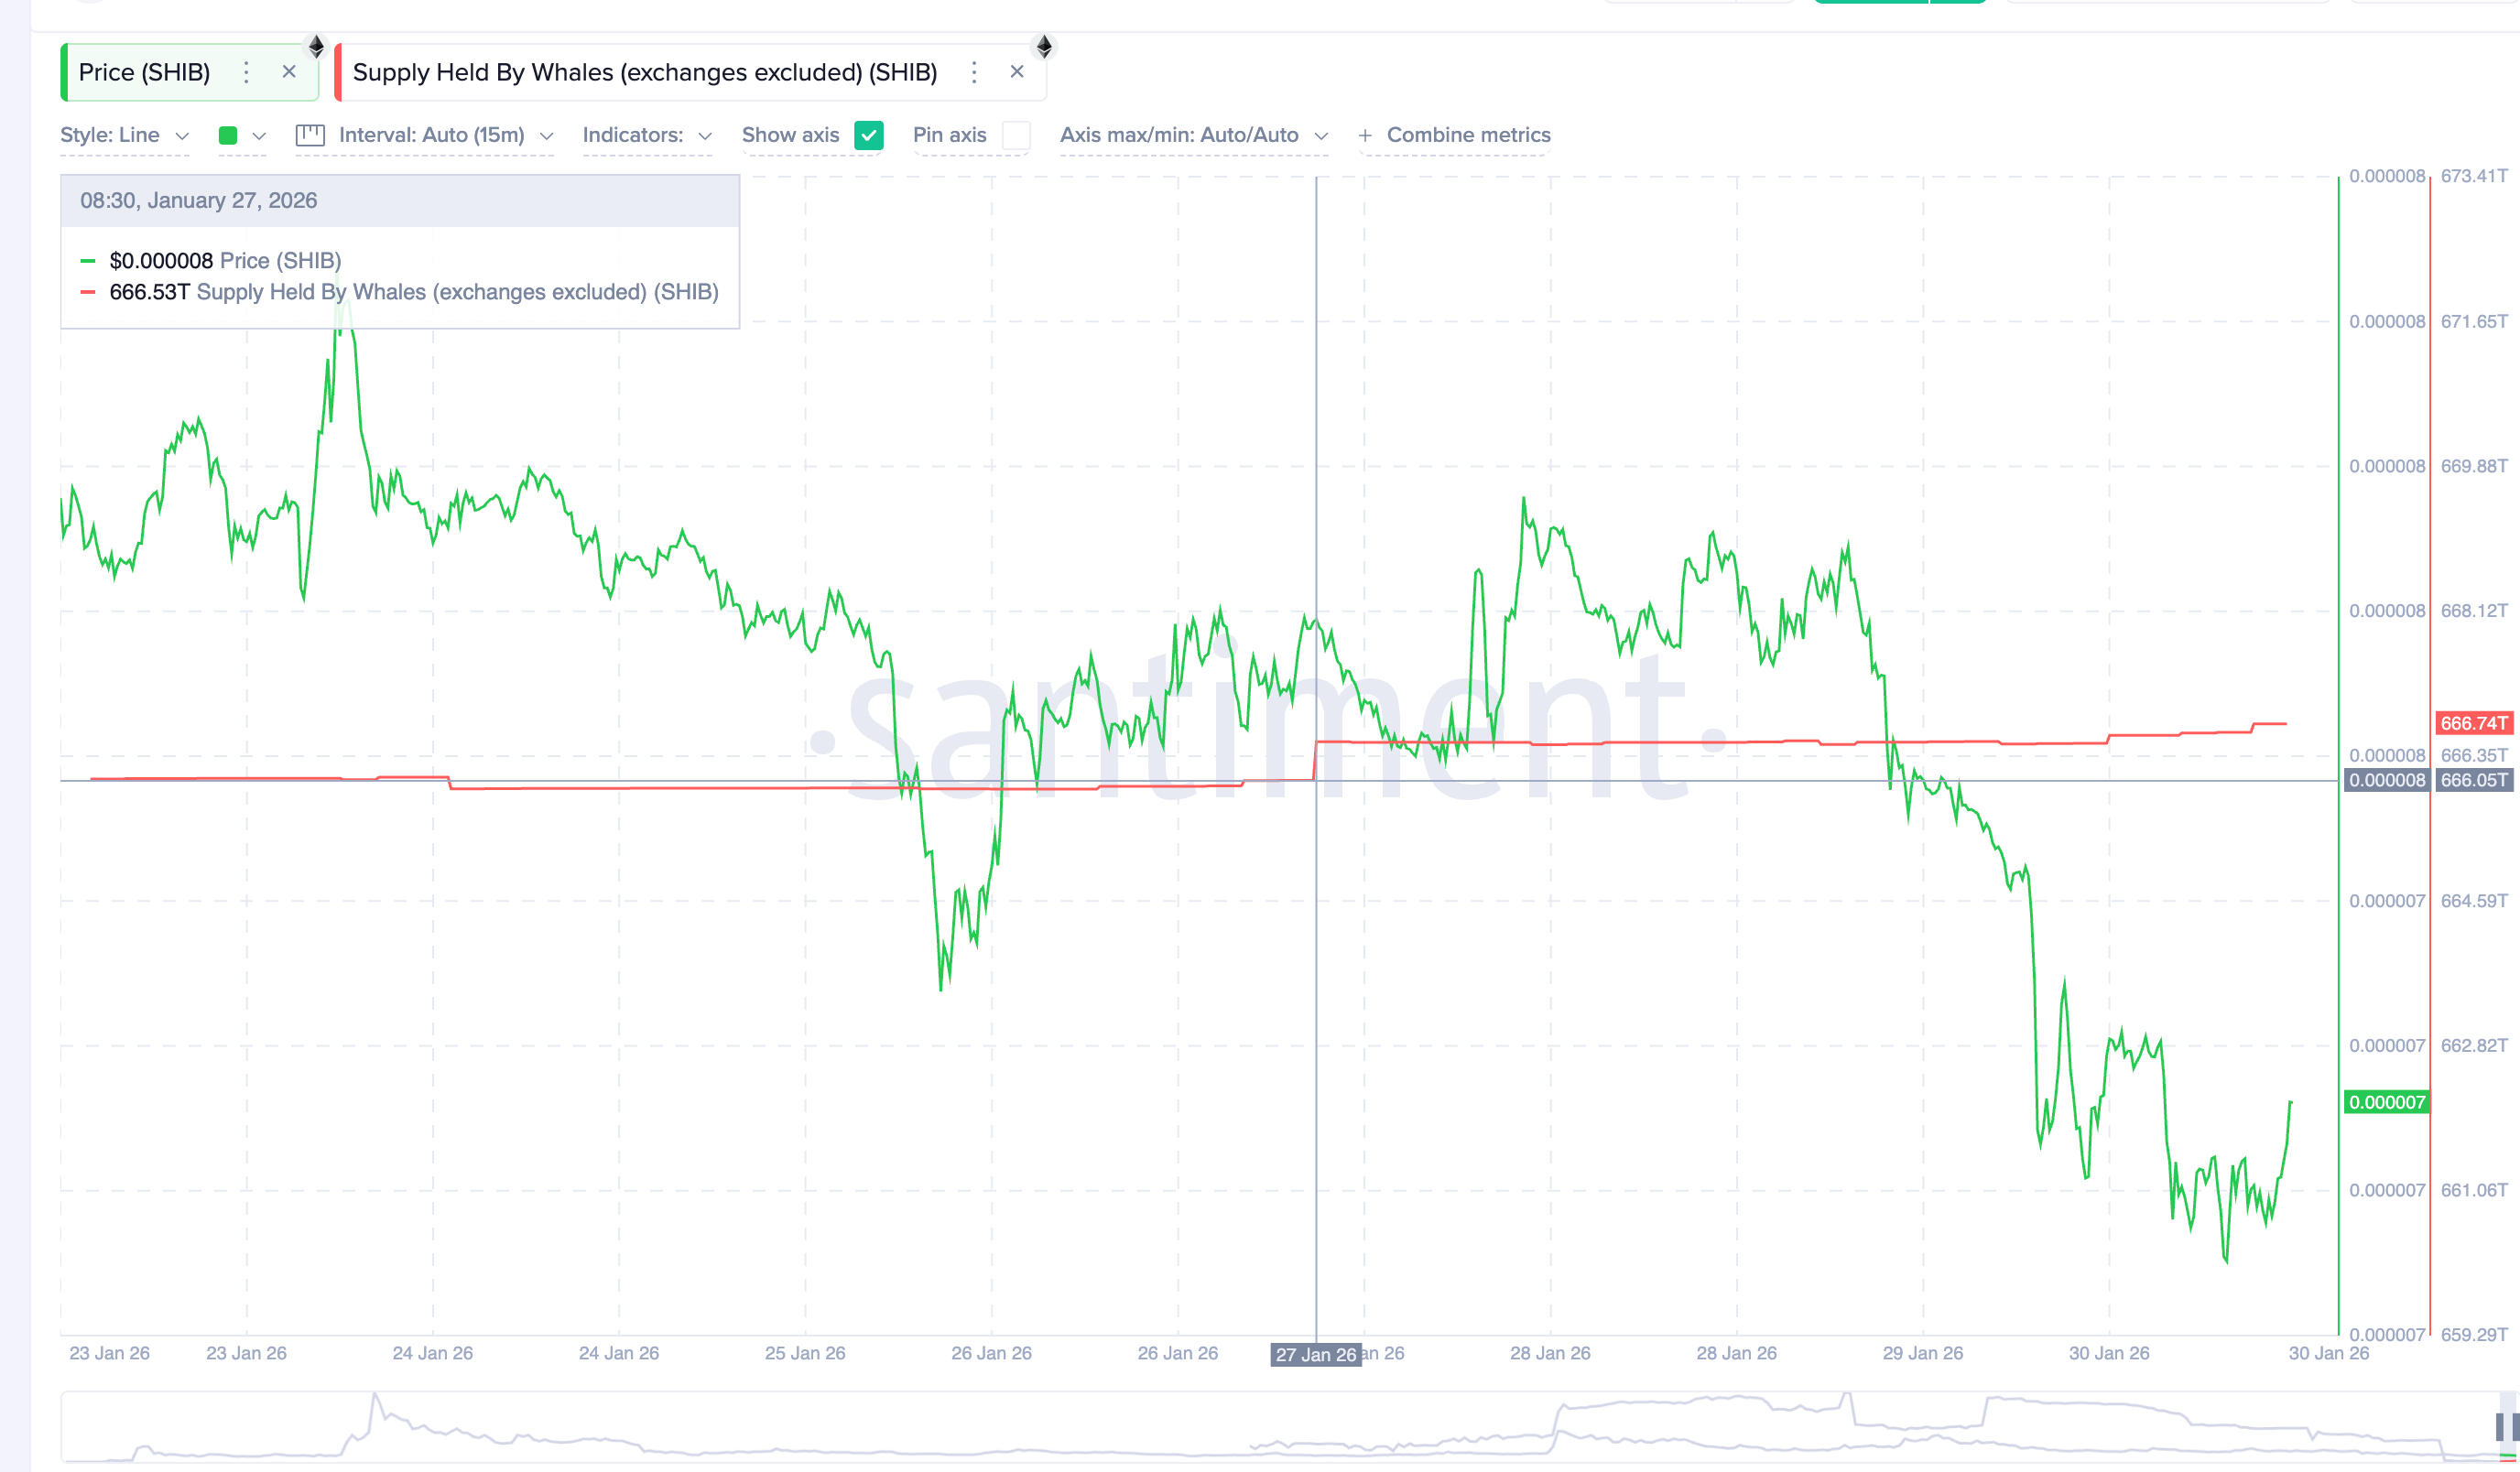 SHIB Whales | Source: Santiment
From November 4 to January 25, SHIB formed a bullish divergence. During this period, the price made lower lows while the Relative Strength Index (RSI) made higher lows. The RSI measures momentum and indicates whether buying or selling pressure is increasing. When prices weaken but the RSI improves, it shows sellers are losing control.
This divergence occurs within a broader descending wedge pattern, a bullish pattern where prices consolidate before potentially breaking out. After the signal appeared on January 25, SHIB printed two green candles, and whales began accumulating from January 27.
Since January 28, SHIB's price has adjusted, but whale balances remain stable. This indicates that large holders are waiting for further confirmation before exiting early.
A similar divergence is currently forming again. To confirm, the next SHIB price candle needs to form above $0.0000071. If that happens, momentum could strengthen towards the important breakout area near $0.0000091, with upside space towards $0.000012.
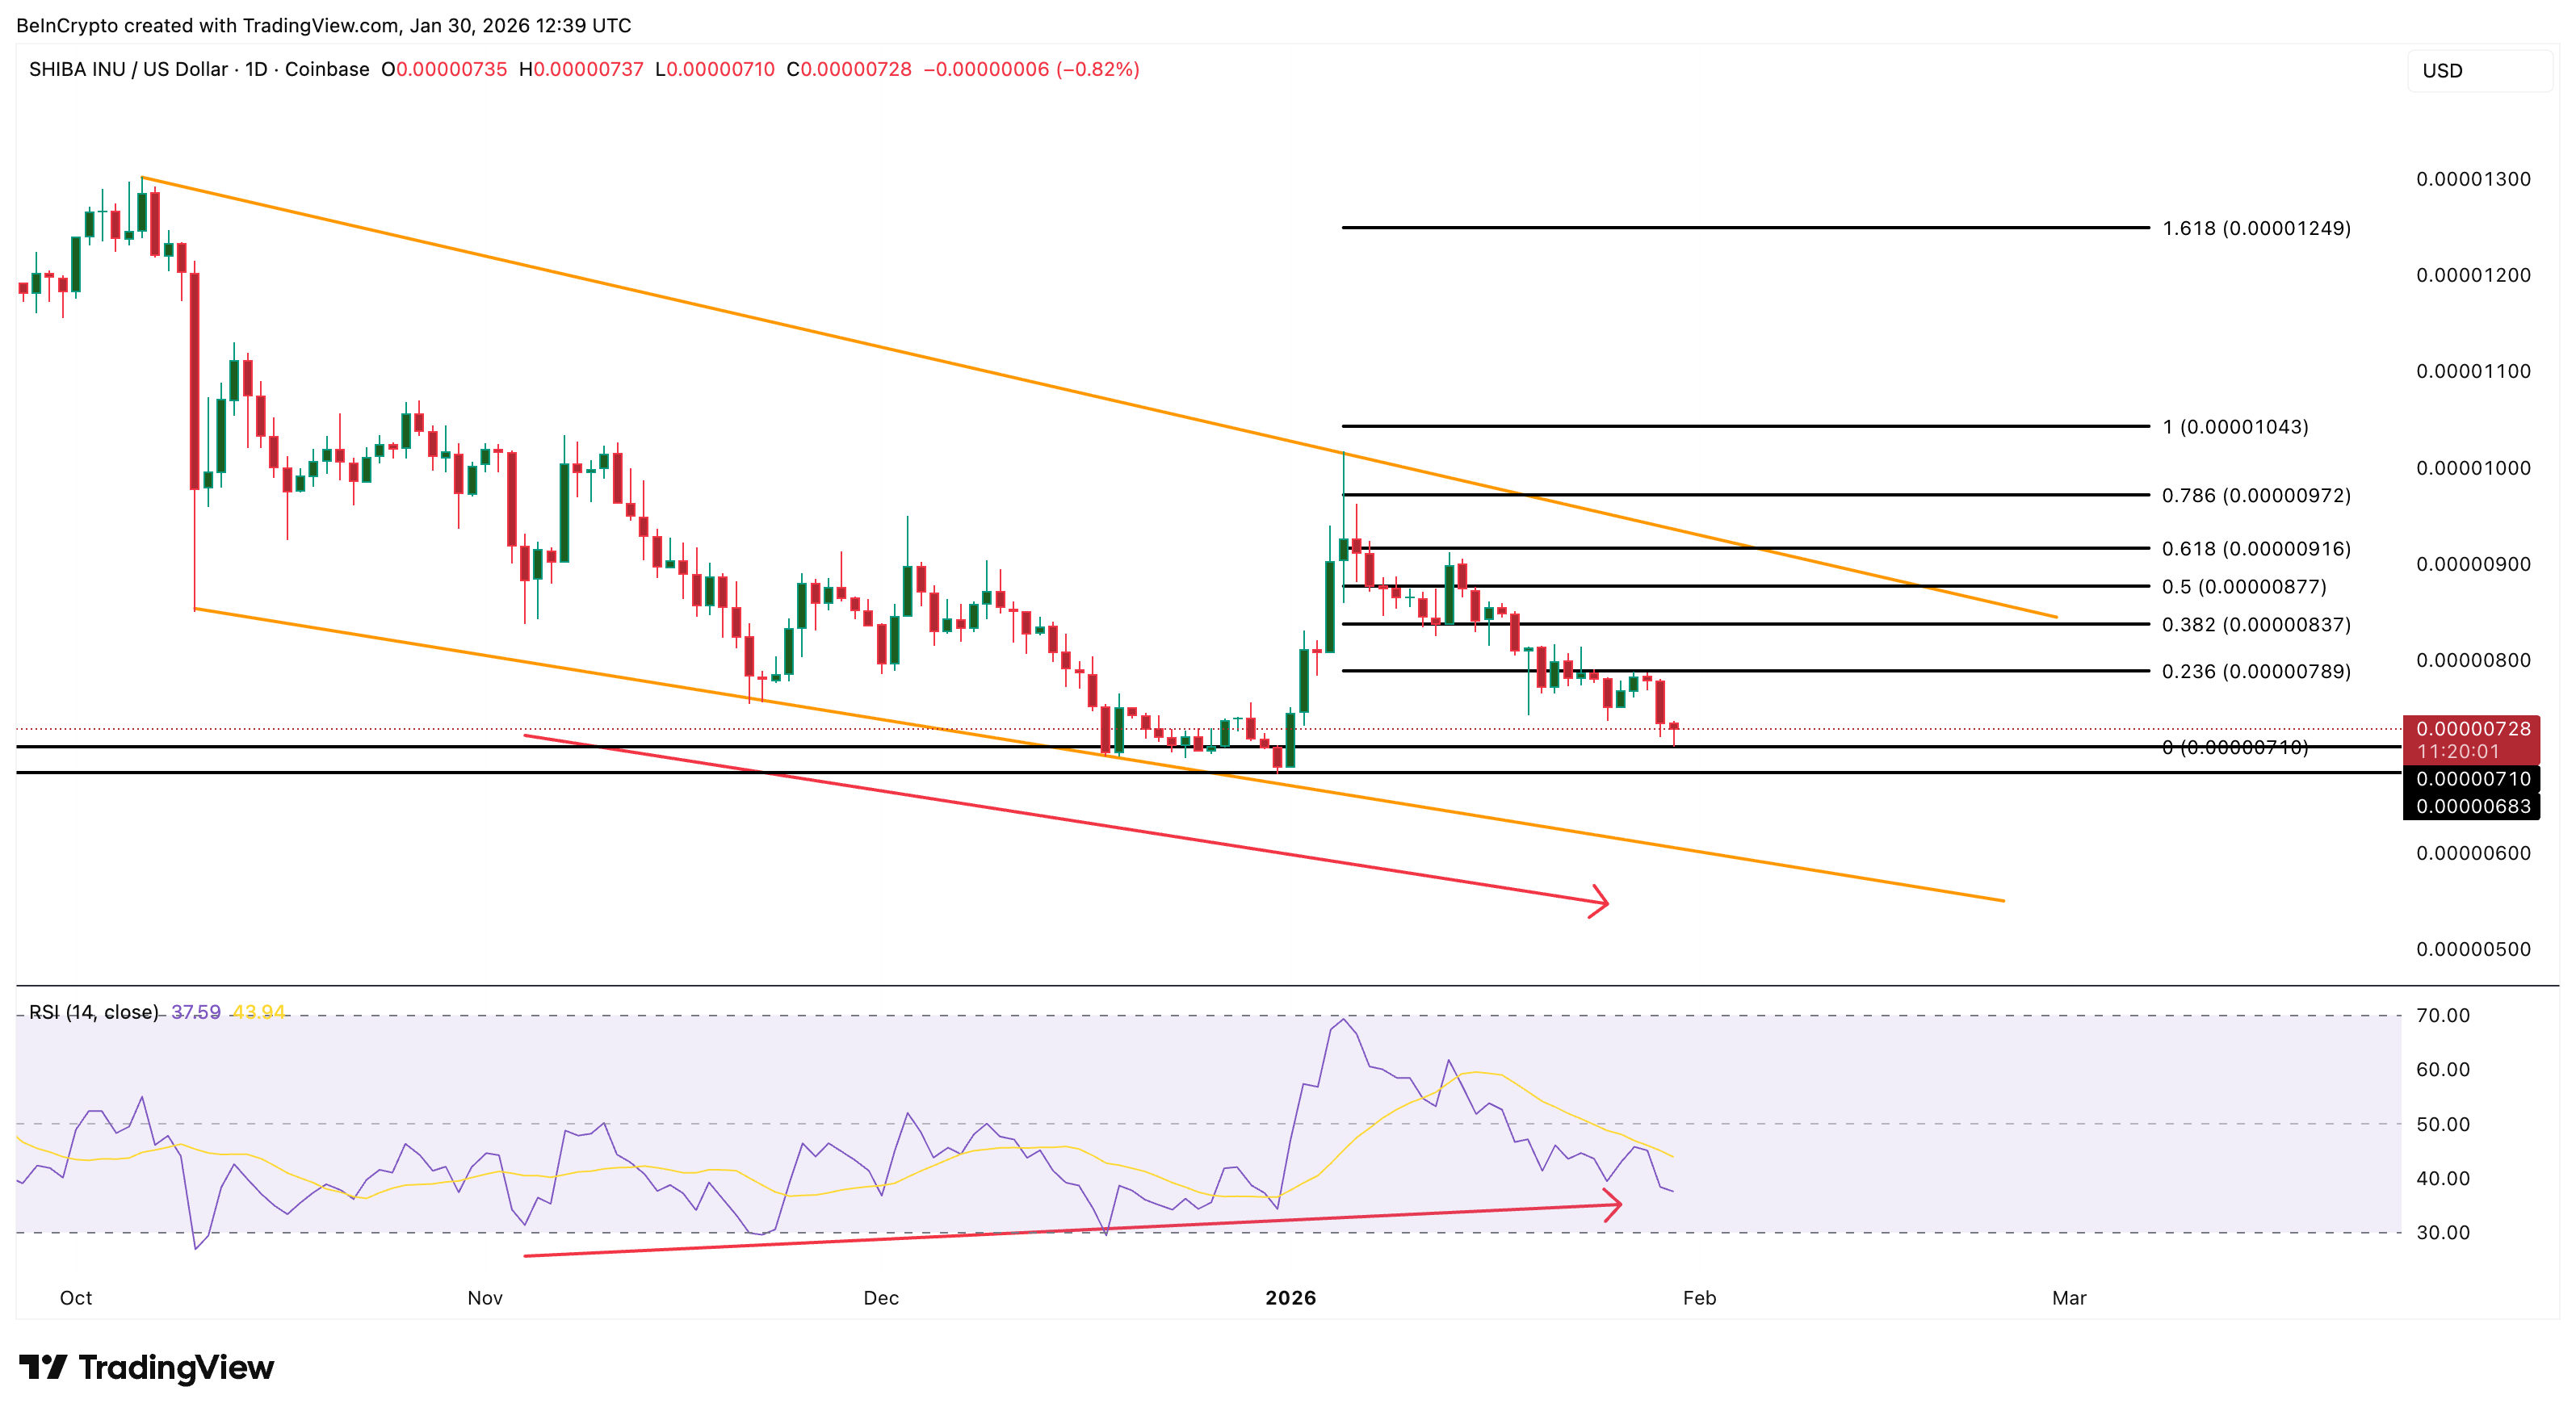 SHIB Price Analysis | Source: TradingView
If $0.0000071 fails, the bullish setup will weaken and downside risks will increase.
Currently, whale accumulation and improving momentum signals suggest SHIB is being positioned as a potential recovery scenario for February.
Pendle (PENDLE)
Pendle is another token that whales seem to be targeting in February, despite recent price weakness. On-chain data shows large holders have increased their holdings of PENDLE from 181.54 million on January 27 to 184.81 million PENDLE, an increase of 3.27 million PENDLE.
At the current price, this accumulation is worth about $6.3 million, signaling strong confidence in the market pullback.
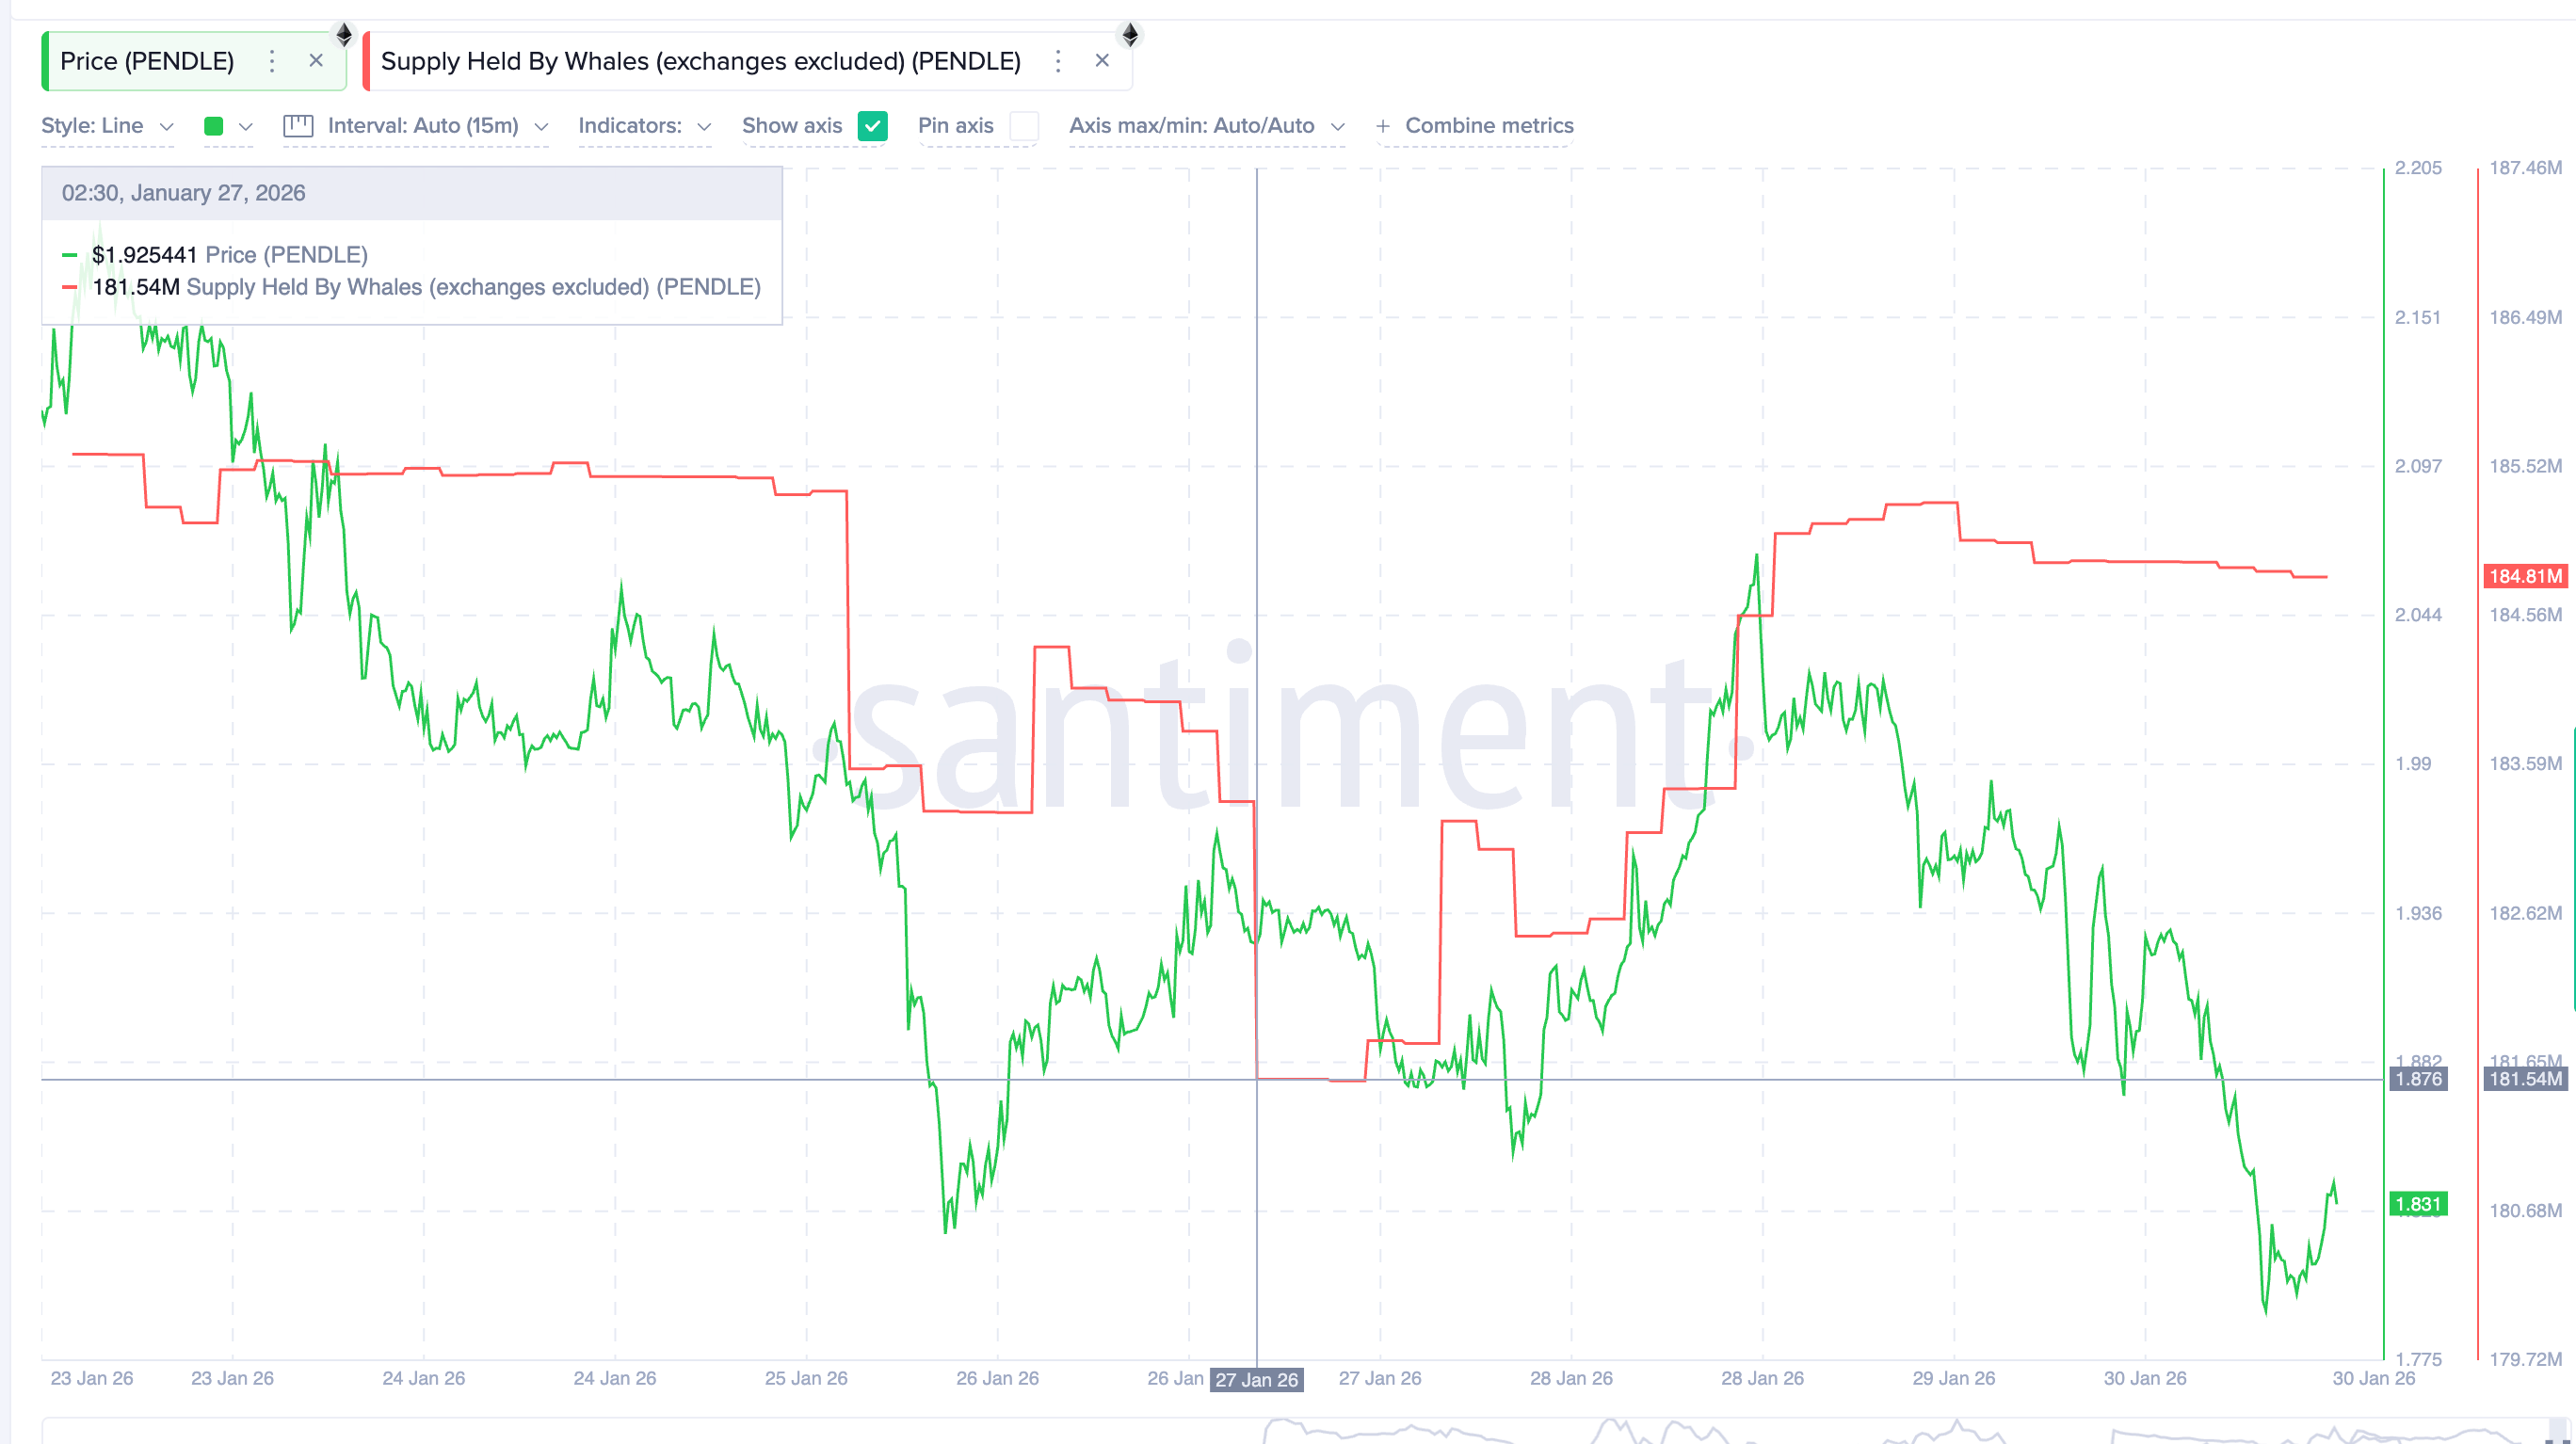 PENDLE Whales | Source: Santiment
This accumulation occurs at a time when PENDLE is struggling. The token has decreased by about 6% in the past 24 hours and nearly 5.2% over the past month, reflecting broader weakness in DeFi and yield-focused assets.
However, whale behavior suggests larger investors may be positioning for a medium-term reversal rather than chasing short-term momentum.
On the 12-hour chart, PENDLE is showing early signs of bullish divergence. From November 14 to January 30, the price made lower lows while the RSI made higher lows.
For this setup to remain valid, the current 12-hour candle must hold above $1.78. If this level is protected, the divergence remains intact, improving the chances of a reversal.
This pattern closely aligns with whale accumulation, which accelerated after January 27, following an earlier divergence signal occurring from November 14 to January 25.
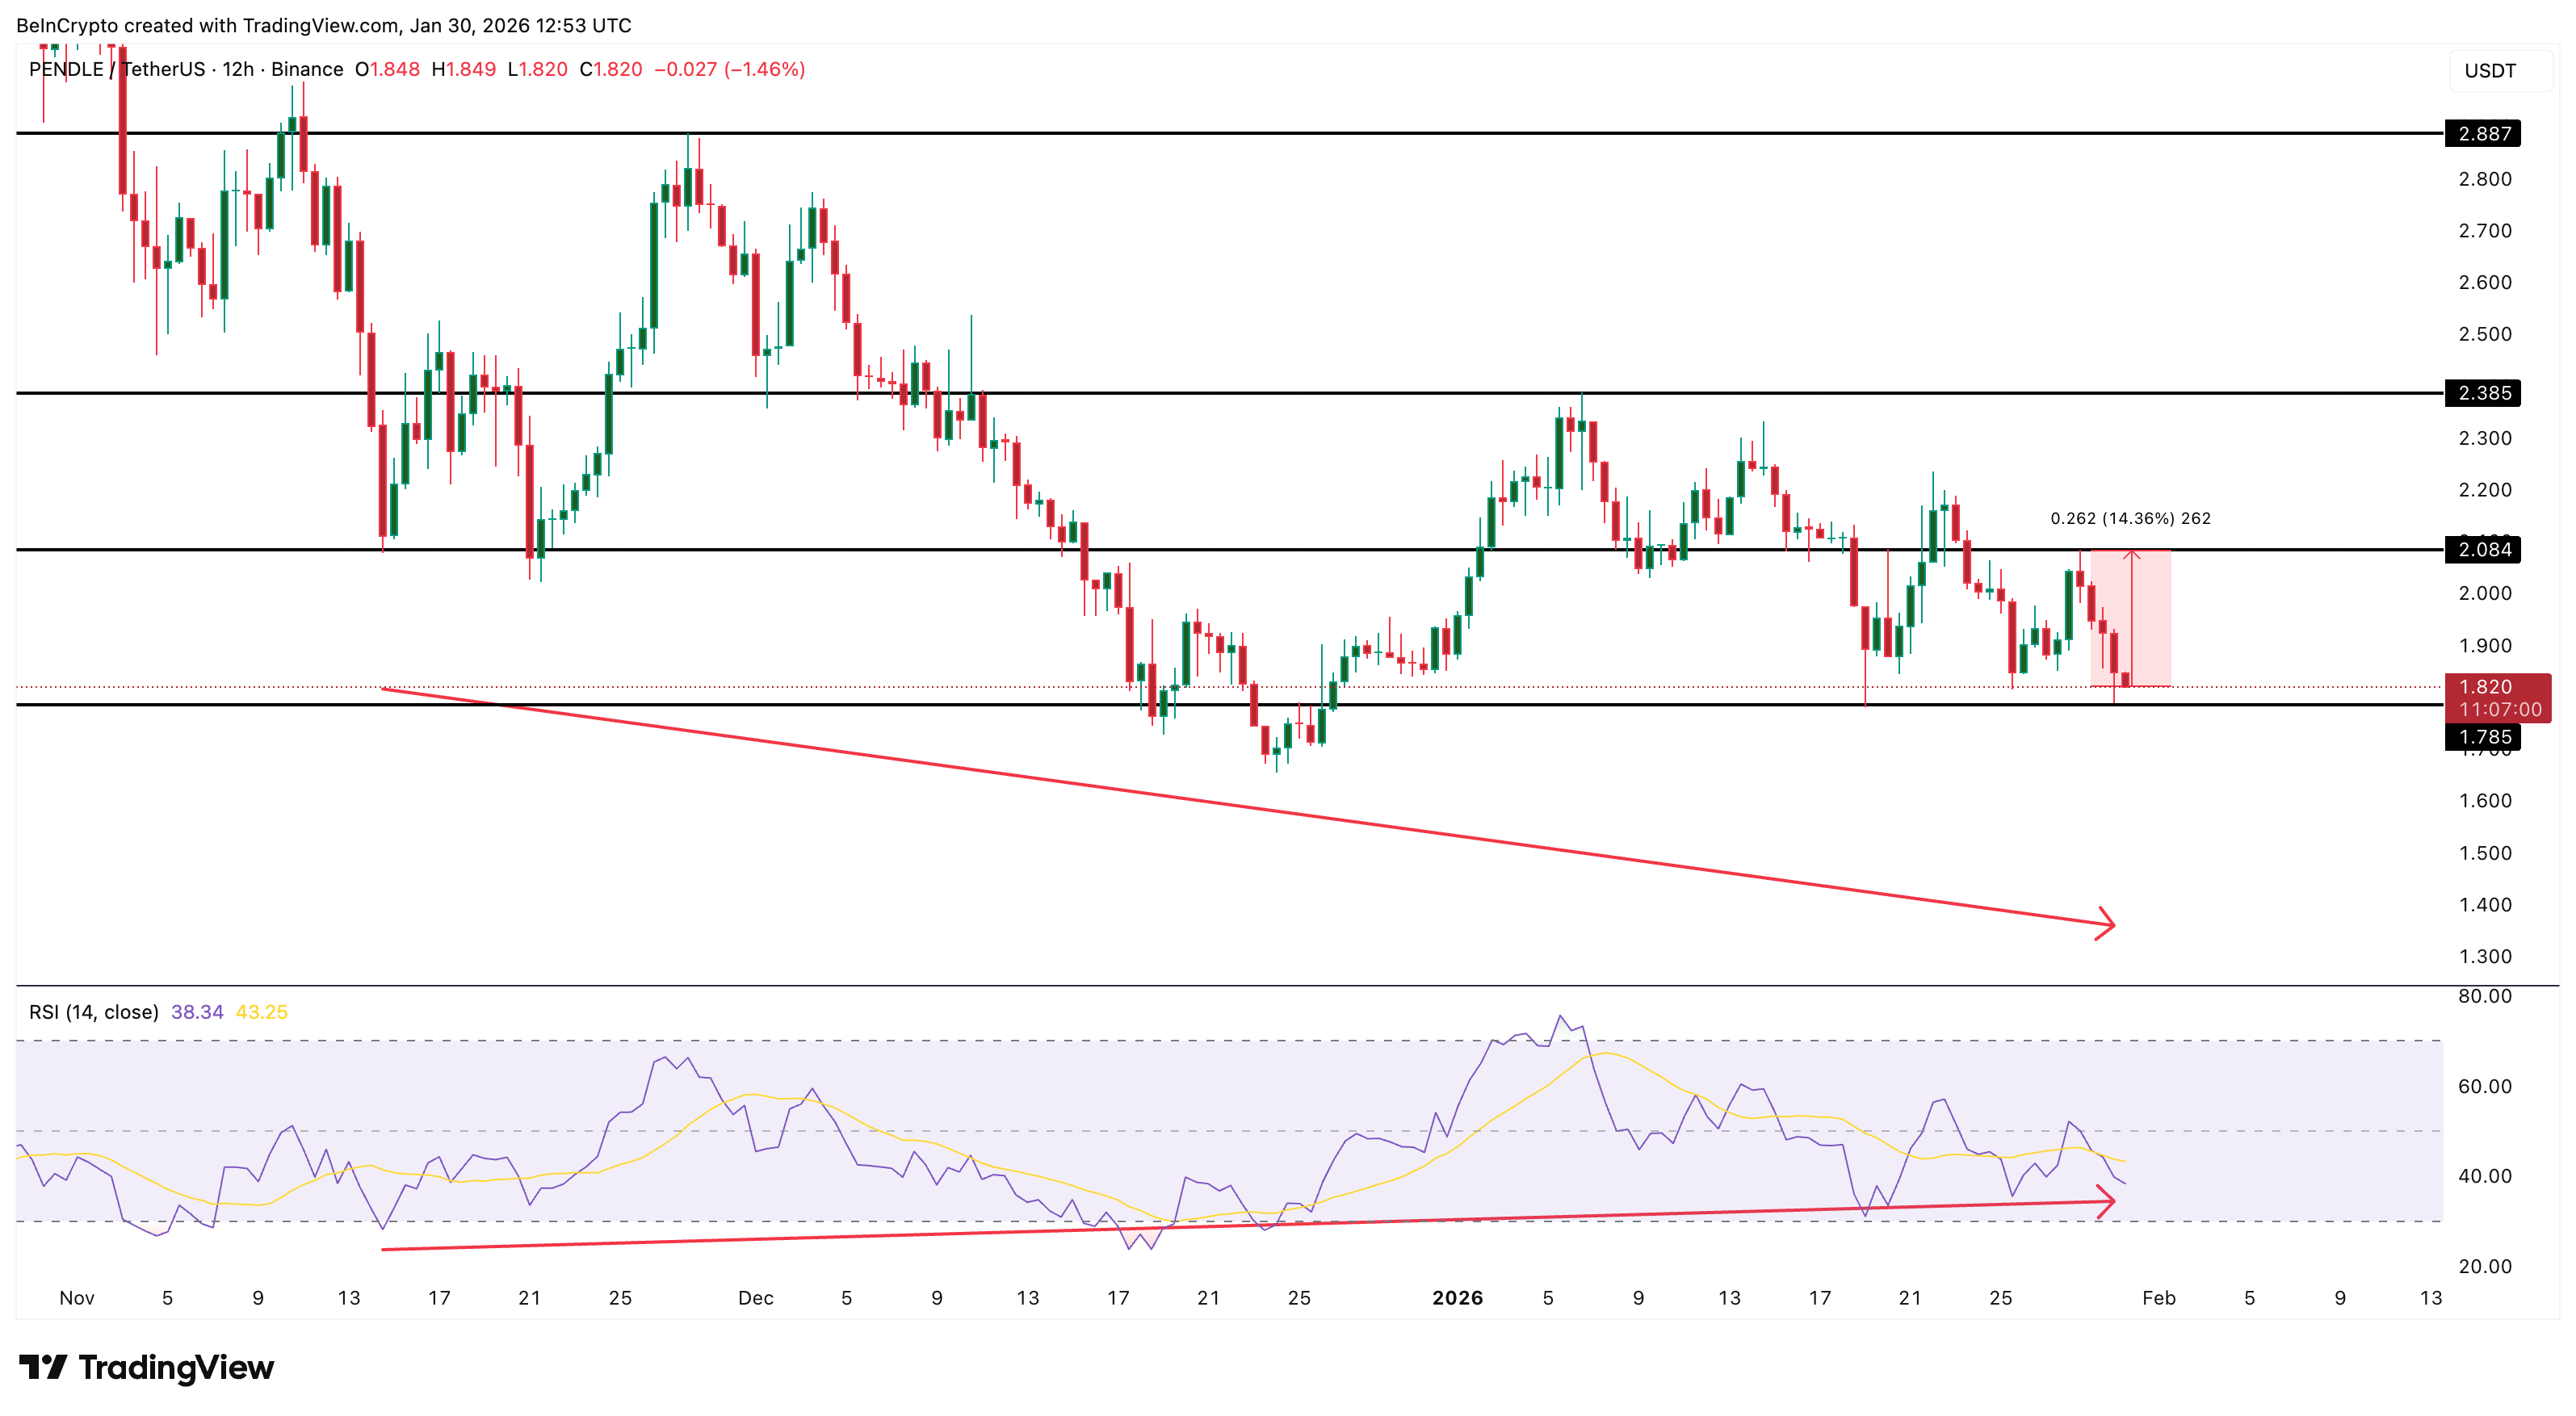 PENDLE Price Analysis | Source: TradingView
If momentum improves, the first resistance lies near $2.08, about 14% above the current level. A breakout there could open space for an increase towards $2.38 and $2.87. However, failure to hold $1.78 would weaken the bullish argument and restore downside risk.
Currently, PENDLE reflects a reversal setup led by typical whales: accumulating into weakness, supported by improving momentum signals.
Cardano (ADA)
Cardano suddenly appeared on the radar of whales as we entered February, driven by strong accumulation through two large holder groups.
Data shows wallets holding 1 billion ADA or more began adding on January 28. Their total holdings increased from approximately 2.93 billion ADA to 3.18 billion ADA. At the same time, the group holding 100 million ADA to 1 billion ADA participated in the move on January 29. Their balances increased from 2.55 billion ADA to 2.60 billion ADA.
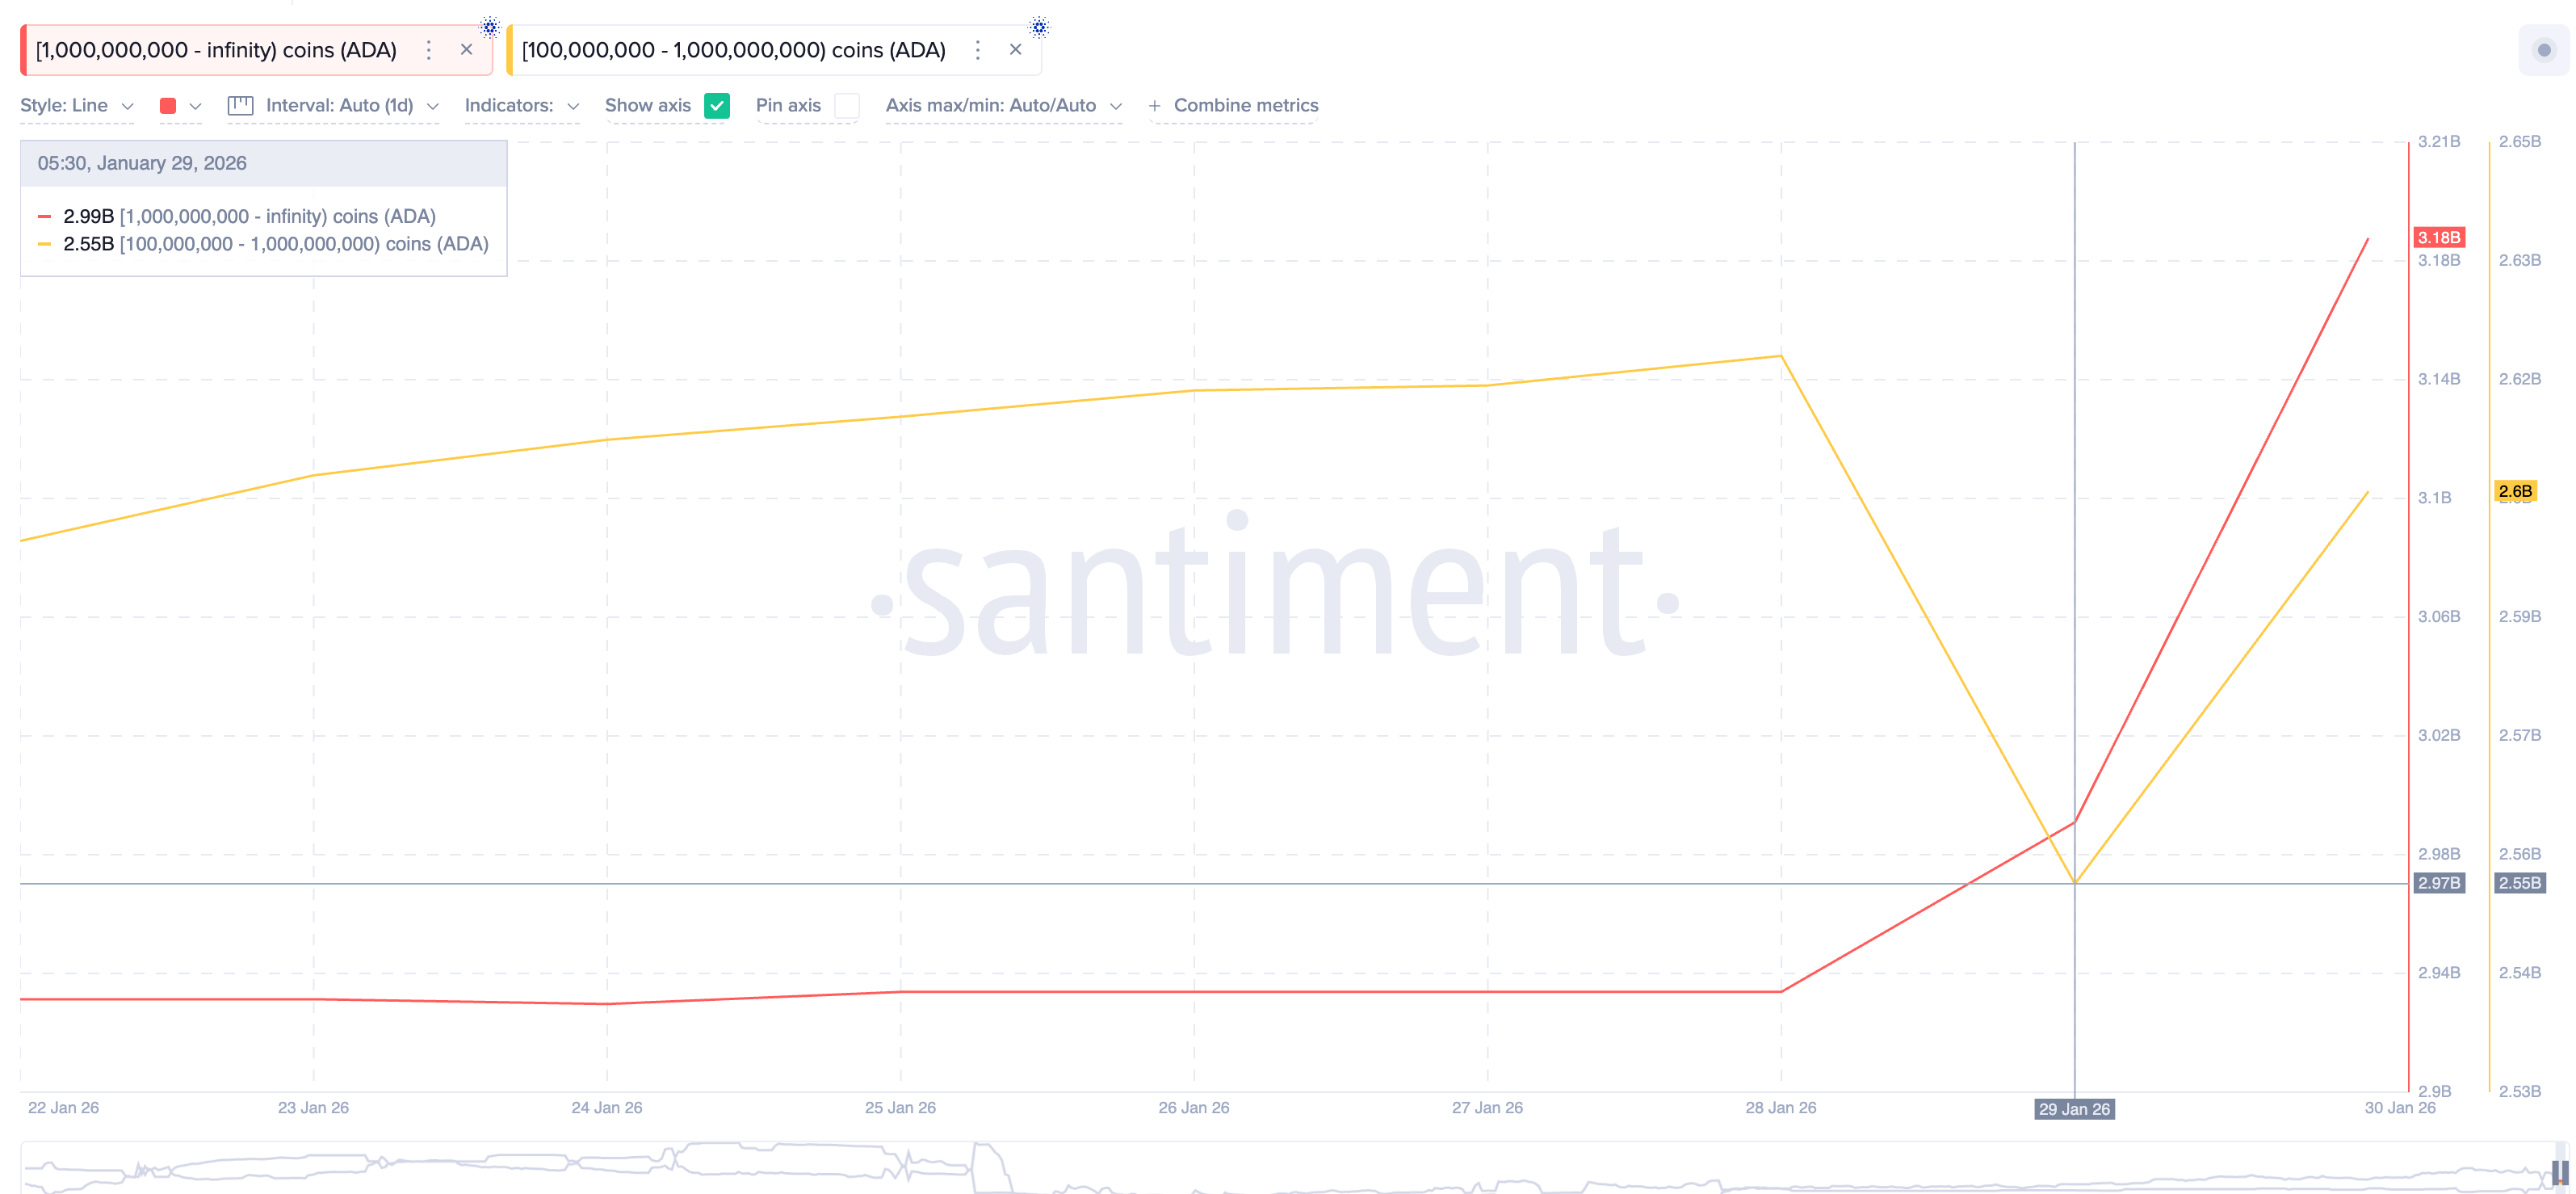 ADA Whales | Source: Santiment
Together, the two largest whale groups have accumulated nearly 300 million ADA in just 48 hours, signaling a coordinated change in positioning.
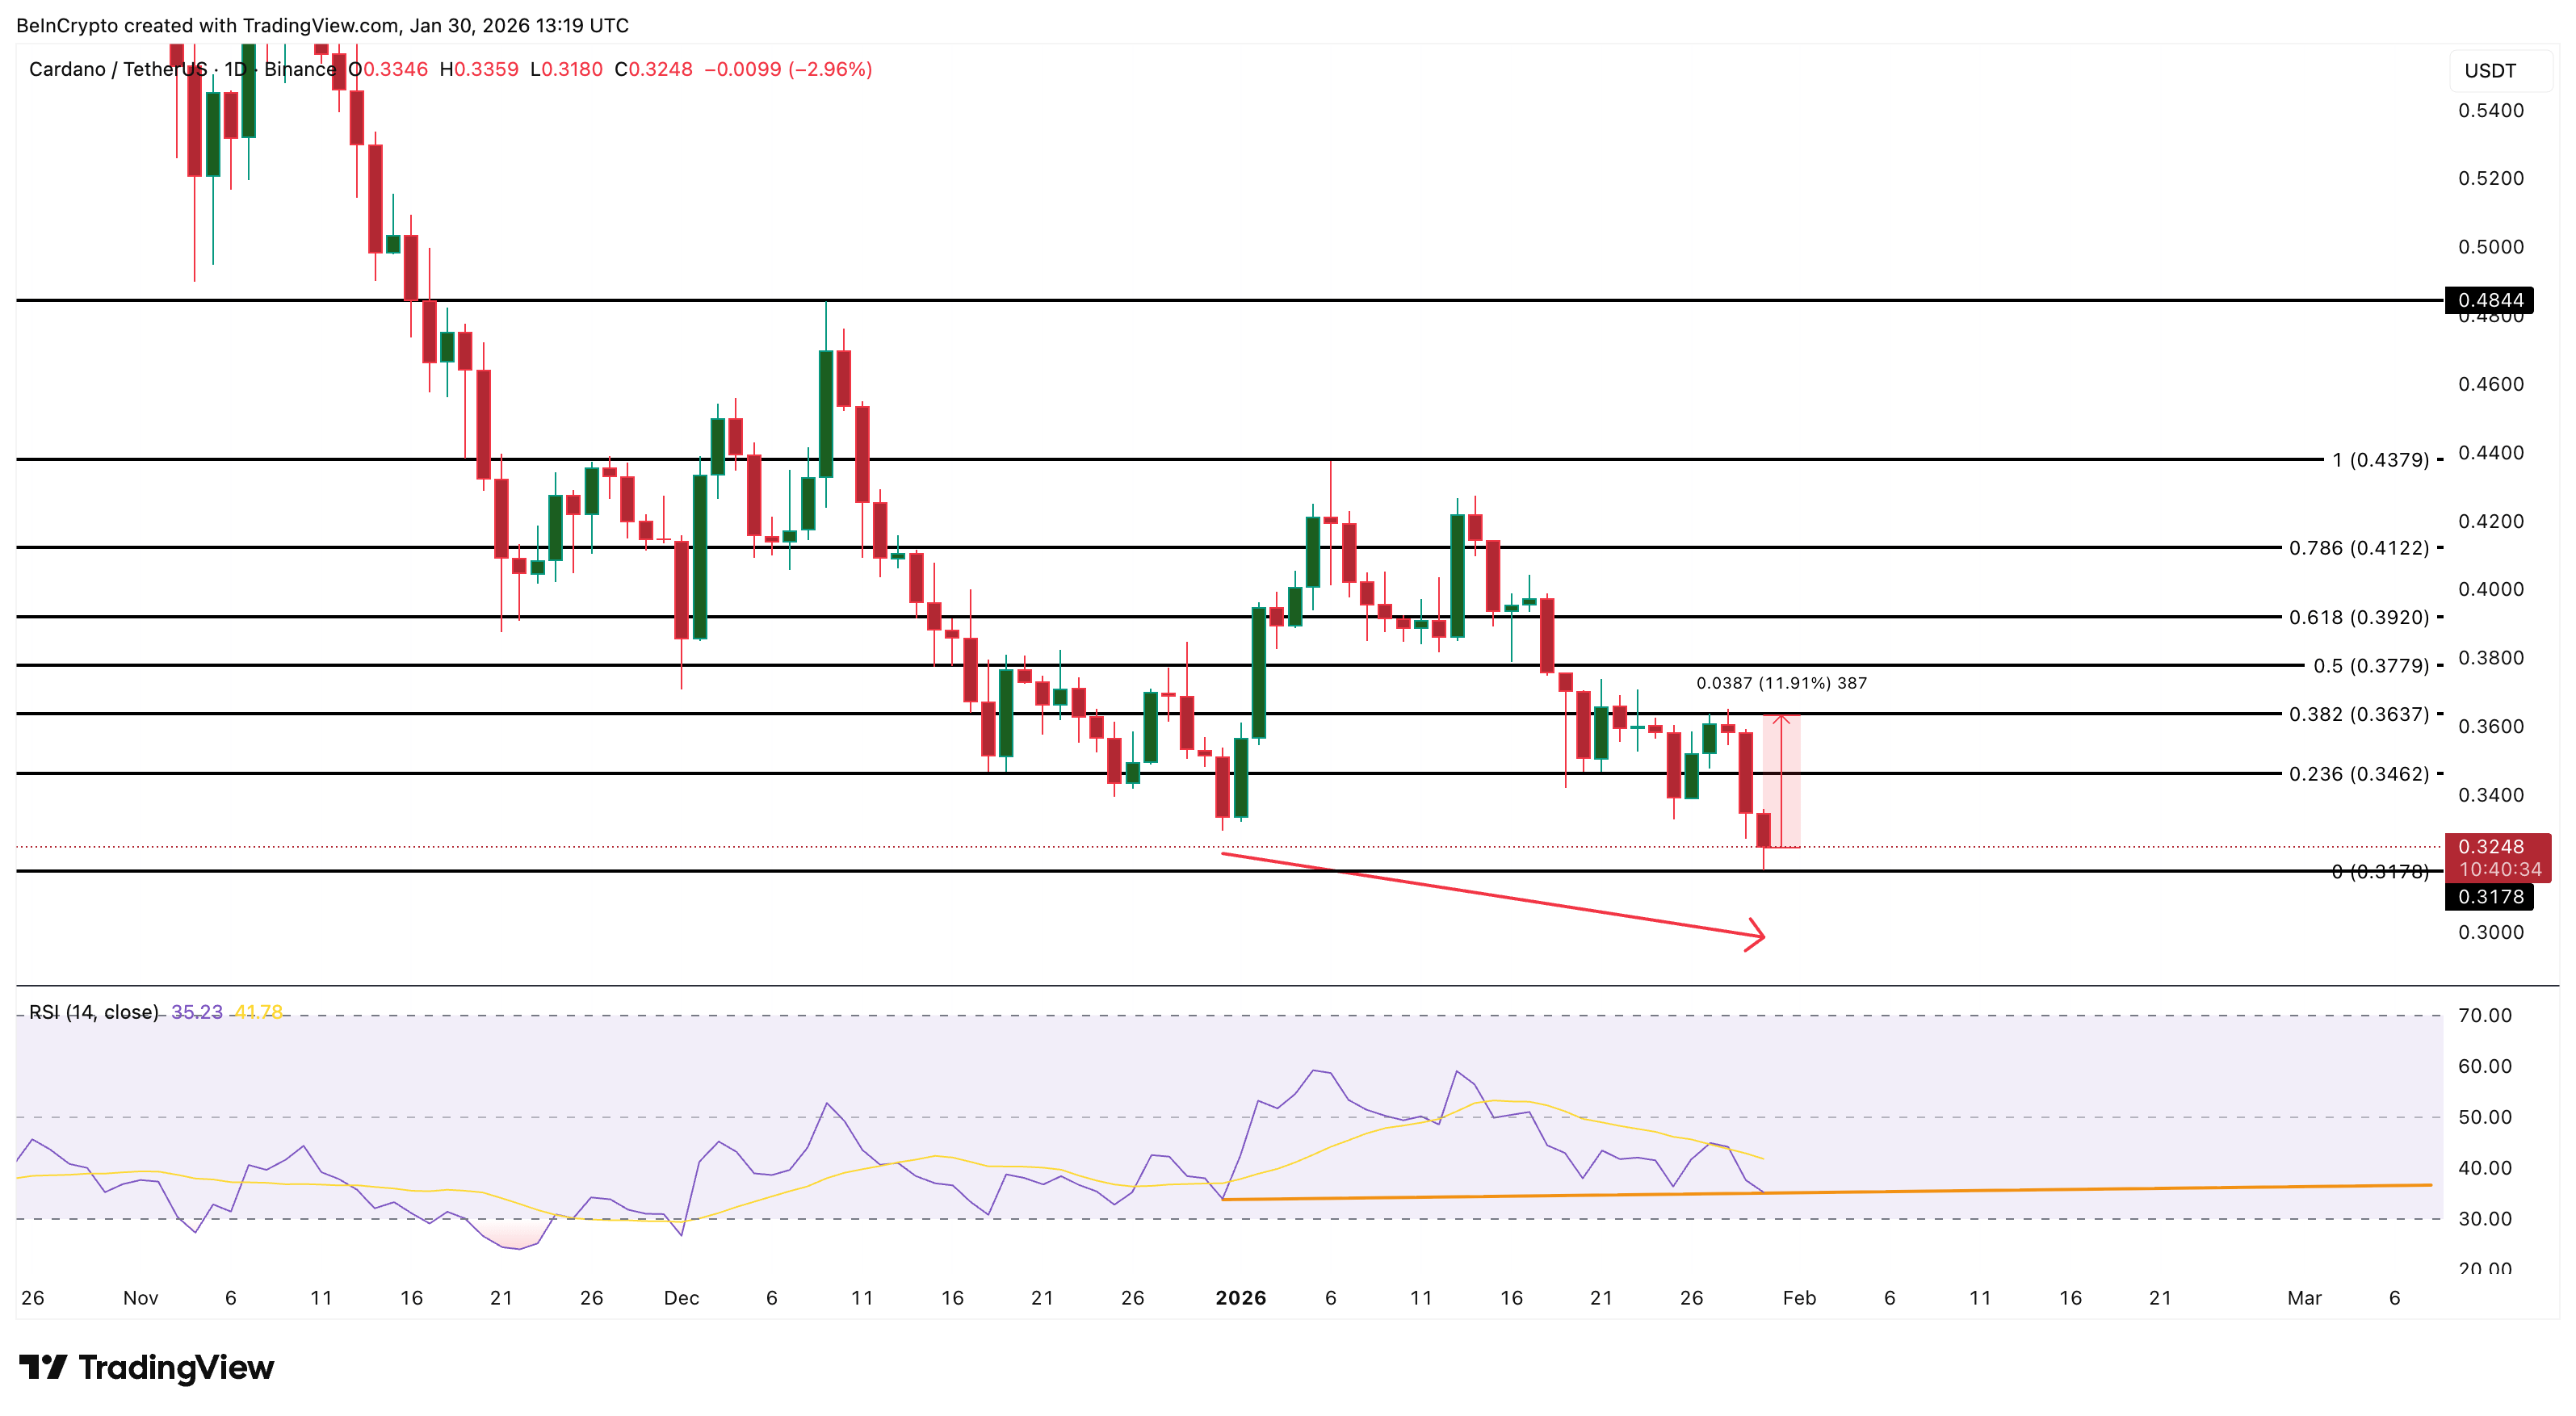
This purchase stands out because Cardano is under pressure. ADA has decreased nearly 6% in the past 24 hours and about 7.2% over the past month, reflecting broader market weakness. On the surface, this does not resemble a bullish environment. But the charts show why whales may be interested.
From December 31 to January 30, ADA printed lower price lows while the RSI printed higher lows. To confirm this bullish divergence, the next price candle must hold above $0.31, and the RSI should now not drop below the level of December 31.
ADA is currently trading near $0.32, maintaining structure. The RSI also needs to stay above its upward trendline.
 ADA Price Analysis | Source: TradingView
If the signal is confirmed, the first recovery target lies near $0.36, an important resistance level that was broken on January 22. Regaining it would mark a potential 12% increase from the current level.
However, a break below $0.31 would invalidate the reversal setup and weaken the whales' argument.
https://coinphoton.com/cac-ca-voi-tien-dien-tu-dang-mua-gi-de-tim-kiem-loi-nhuan-tiem-nang-vao-thang-2-nam-2026.html