

📉 Bitcoin Market Analysis: Local Downtrend and Key Support Levels
Date: January 31, 2026
Timeframe: 15-Minute (Short-term)
1. Market Overview
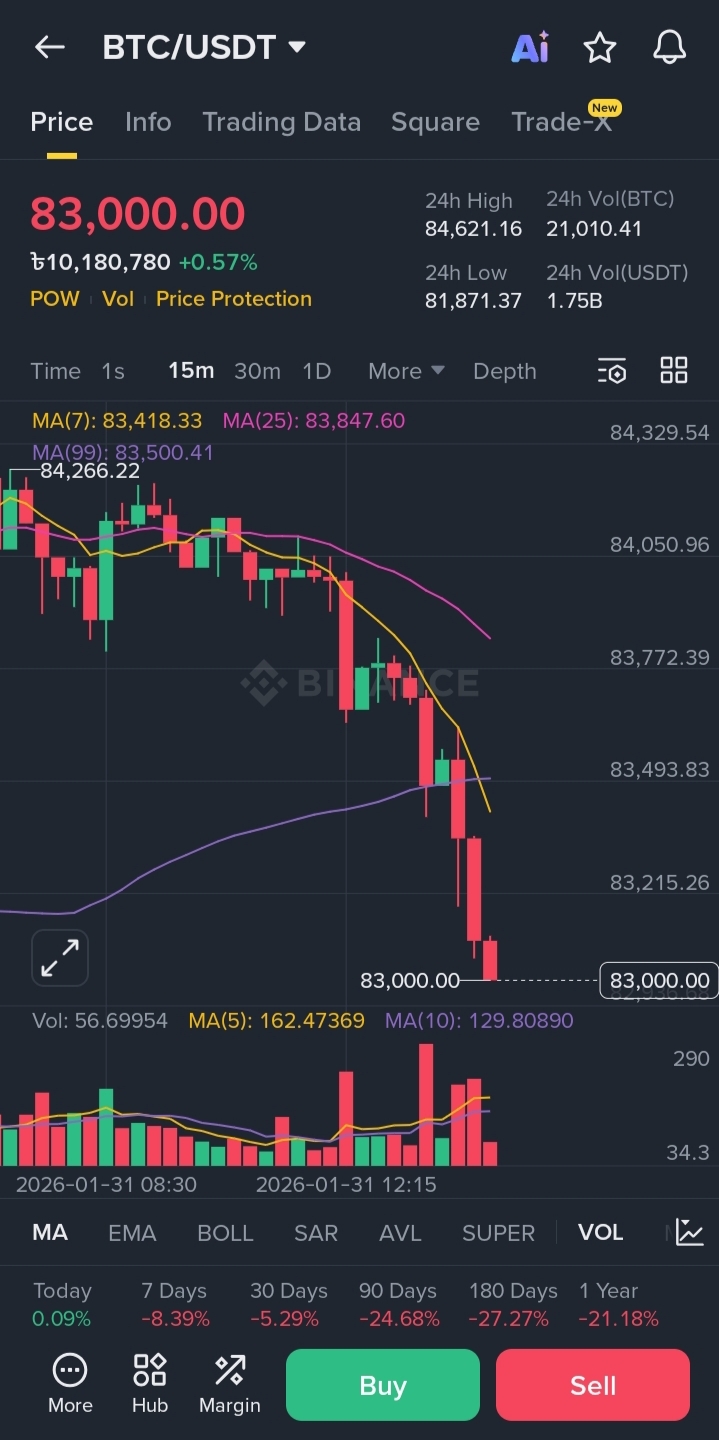
The current price of Bitcoin is sitting exactly at $83,000.00. Looking at the 15-minute chart, we can see a clear bearish momentum over the last few hours. After failing to hold the $84,000 level, the price has experienced a sharp decline.
Currently, the price of Bitcoin is at $83,000.00. According to the 15-minute chart, a strong bearish trend has been observed in the market over the last few hours. The price has sharply dropped after failing to hold the support at $84,000.
2. Technical Indicators Analysis
Moving Averages (MA): The price is currently trading below all major moving averages—MA(7), MA(25), and MA(99). This indicates that the short-term and medium-term trend is bearish. Specifically, the MA(7) is dropping sharply, acting as immediate resistance.
Candlestick Pattern: The last few candles are large red "Marubozu" style candles, showing aggressive selling pressure. However, the price has touched a psychological round number ($83,000), which might offer temporary relief.
Volume: We see a spike in red volume bars during the dump, confirming that the downward move is backed by significant selling activity.
Moving Average (MA): The price is currently below all significant moving averages (MA 7, 25, 99). This indicates that the short and medium-term trend is now downward. Specifically, MA(7) is dropping rapidly, currently acting as a resistance.
Candlestick Pattern: The last few large red candles indicate that there is a lot of selling pressure in the market. However, the price has hit a 'round number' ($83,000), which may provide temporary support.
Volume: The red volume bars are increasing as the price drops, meaning that large traders are selling in this position.
3. Key Levels to Watch
Support: $83,000 is the immediate psychological support. If it breaks, the next major target could be around $82,500 - $81,870 (24h Low).
Resistance: For a recovery, BTC needs to break back above $83,400 (MA 7) and consolidate. The major hurdle is at $83,800 (MA 25 & 99 junction).
Support: $83,000 is the nearest psychological support. If broken, the price could drop to between $82,500 and $81,870.
Resistance: The market must regain stability above at least $83,400 to turn positive again. There is a major obstacle around $83,800.
💡 Strategy for Traders
Caution: It is risky to enter a "Long" (Buy) position right now until a clear reversal pattern or a "Double Bottom" forms at $83,000. Short-term scalpers may look for quick bounces, but always use a tight Stop Loss (SL) below $82,800.
Caution: Until a reversal signal is found at the $83,000 level, entering a new 'Buy' (Long) position is risky. Scalpers may take profits from small bounces, but should definitely use a stop loss (SL) below $82,800.