

SOL Spot analysis Weekly TF
How I read the structure
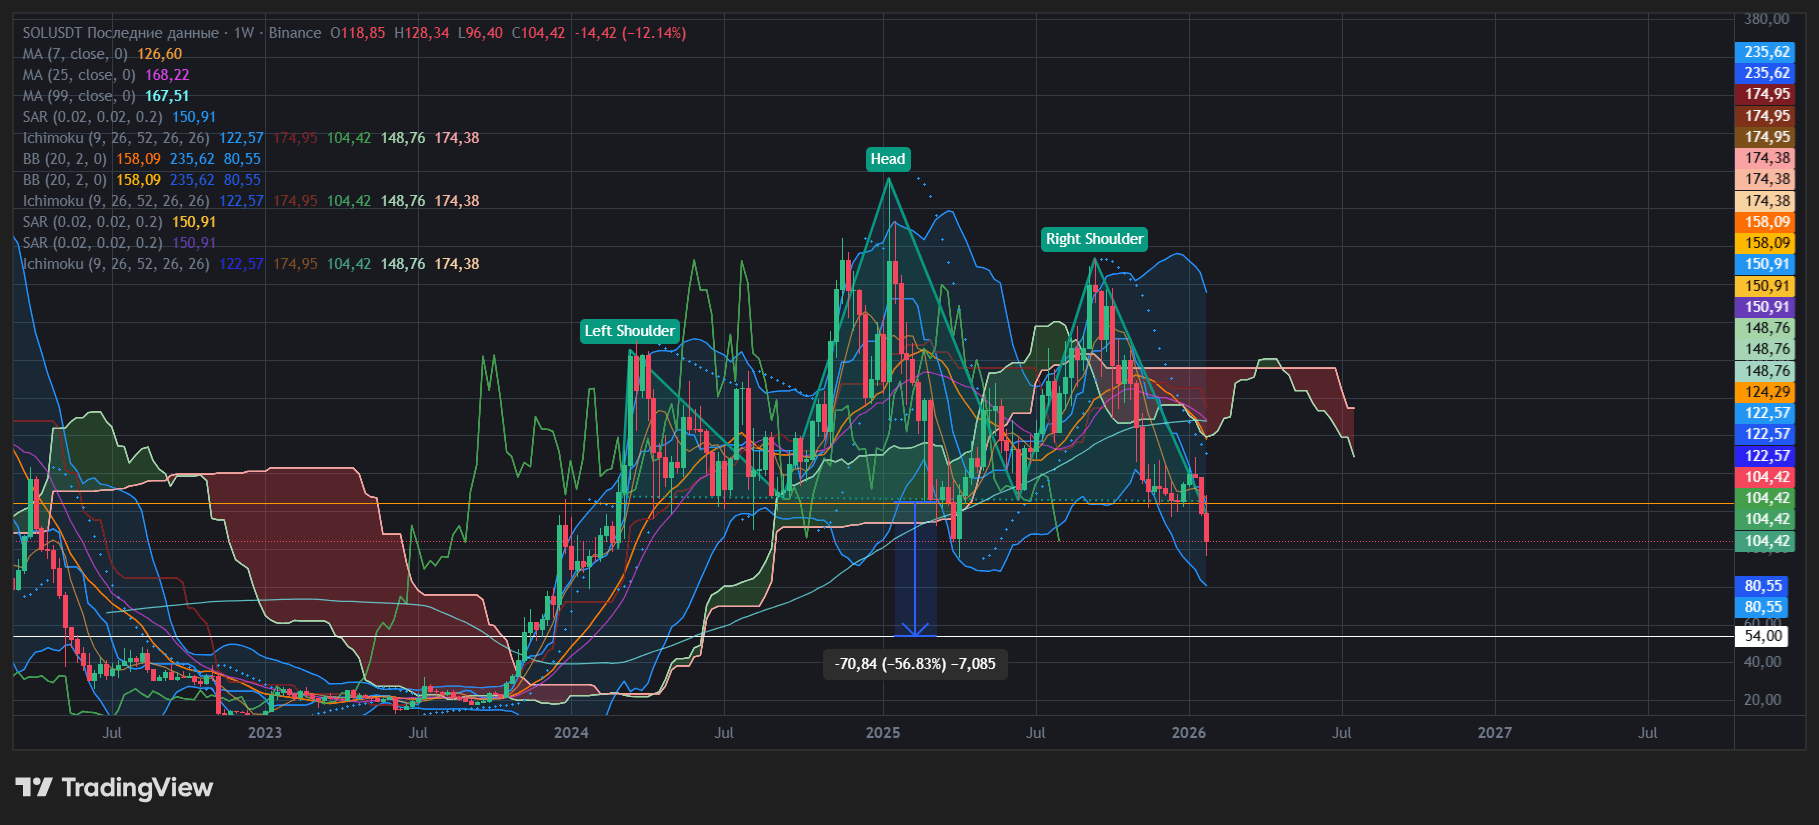
On the SOL chart, a Head and Shoulders pattern is clearly formed on the macro time frame. The Head is around $293, the shoulders are lower, and the right shoulder is weak — a classic sign of trend reversal. The breakout of the neck line has already occurred, and the structure is confirmed.
Key level
The neckline is in the $120–122 zone. The price is currently trading around $104, and this level is already acting as resistance. As long as SOL is below $122 — the scenario remains bearish.
Projection of decline
According to the textbook, the target is considered from the head to the neckline and is projected downwards. In our case, this gives an extremely deep target, so I am focusing on market demand zones rather than the formula:
• $100–104 — current reaction
• $80–85 — strong historical support (priority zone)
• $54–60 — next capitulation zone with increased pressure
Indicators
Price below EMA(7/25/99), below the Ichimoku cloud, MACD in the negative. RSI(6) in deep oversold territory — sharp bounces are possible, but for now, they are corrective.
Output
The figure is working out correctly, the trend is broken. Until a return and consolidation above $122 SOL, it remains a seller's market for me.
Insider information from the analyst: interest in the set will only appear after a confirmed reaction from $80–85 or after a return above the neckline.
👉 Follow along $SOL
