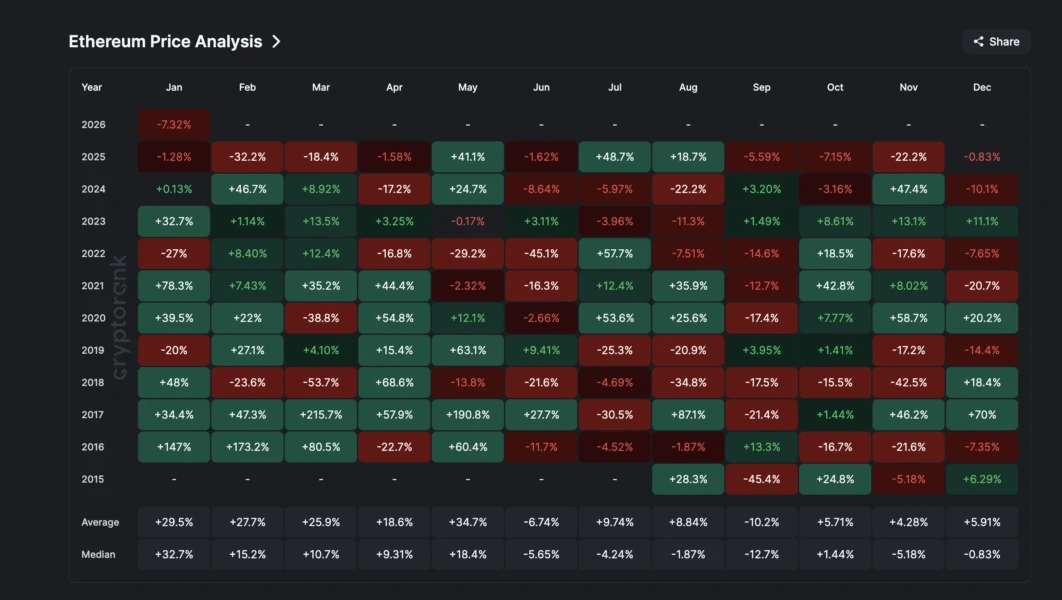
$ETH enters February 2026 in a state of uncertainty. After a nearly 7% decrease in January, the asset is showing dynamics that differ from historical performance. Typically, the median return in the first month of the year is around +32%, however, the current period has been an exception. February is traditionally considered a more moderate month with a median growth of 15% since 2016.
A similar situation was observed in 2025. At that time, January weakness turned into a price drop of 37% over the following month. Further price movement in 2026 will depend on a combination of technical factors, blockchain data, and the activity of institutional investors.
Technical picture and market indicators
Many analysts urge not to rely solely on seasonality. In particular, experts from the B2BINPAY ecosystem note the absence of obvious growth catalysts in the short term. In their opinion, the market needs a clear impulse to determine the direction of movement.
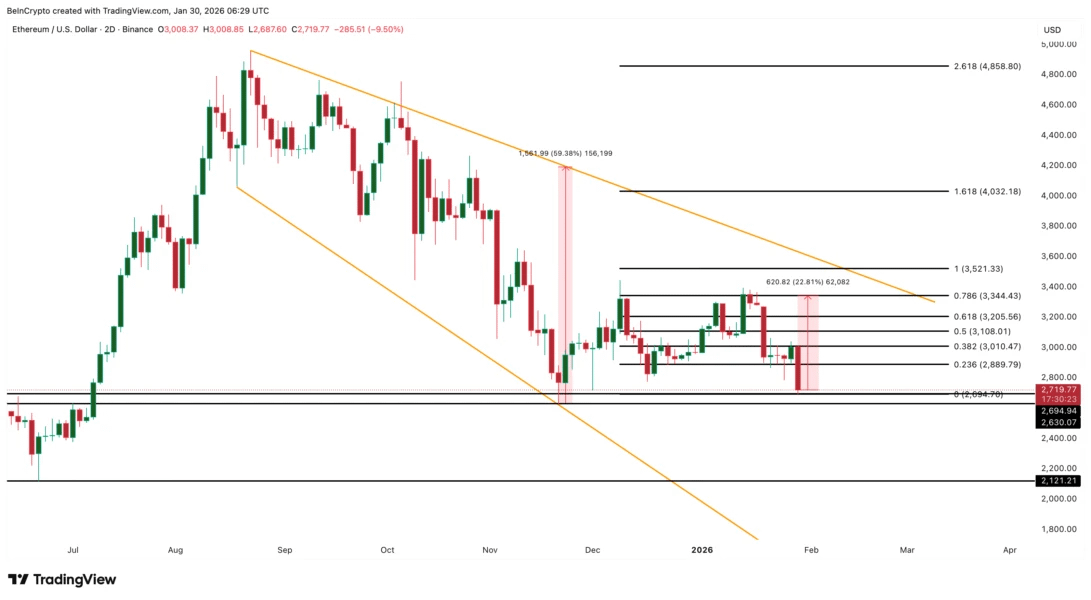
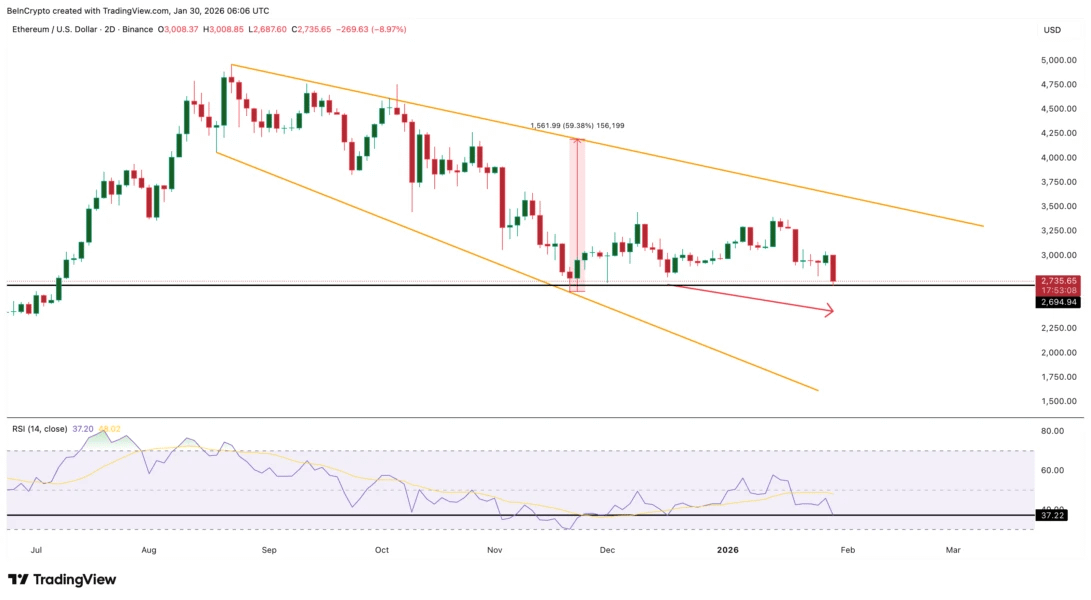
On the two-day chart, Ethereum quotes remain within the 'falling wedge' pattern. This model is formed by sequentially decreasing highs and lows. It often indicates a weakening of selling pressure. A confirmed breakout from this pattern could lead to significant growth, although current volatility keeps risks.
The Relative Strength Index (RSI) indicates the formation of a bullish divergence. From mid-December to the end of January, the price was making new lows while the RSI values stabilized. This is a classic sign of exhaustion of the downward trend. If the price holds above $2690, the likelihood of a reversal will significantly increase.
Blockchain data analysis and investor behavior
The metric of net unrealized profit and loss (NUPL) is currently in the 'hope and fear' zone with a value of 0.19. Historically, such levels preceded major rallies. For example, in June 2025, after similar readings, the asset's price increased by more than 110%.
Nevertheless, the signal cannot be considered complete yet. A full market bottom is usually accompanied by NUPL moving into negative territory, indicating total capitulation of participants. Current values indicate more of a possibility for a local bounce rather than the start of a new global cycle.
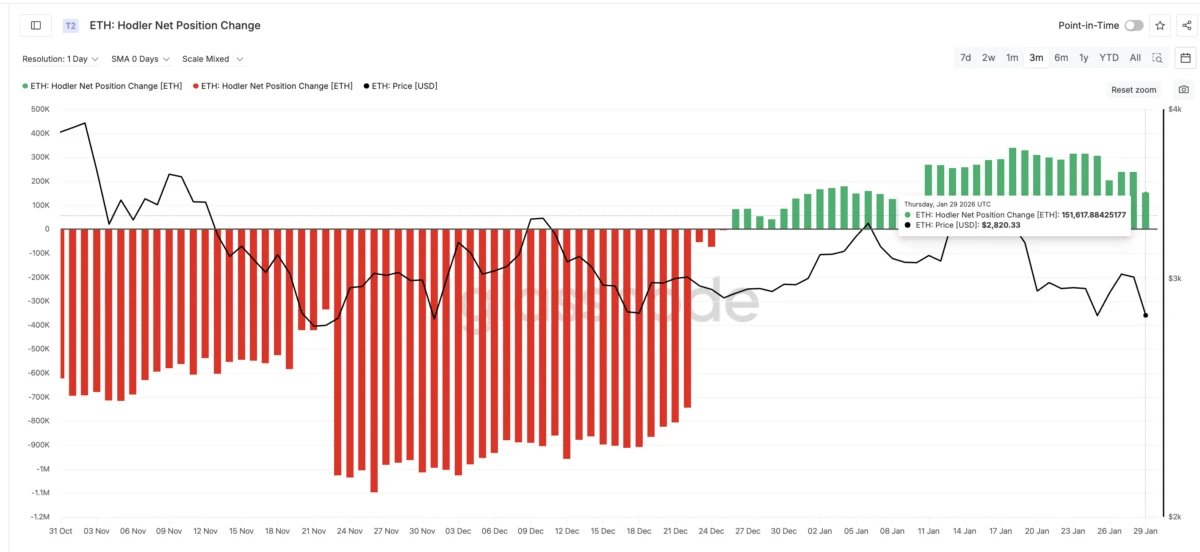
The behavior of long-term investors also appears ambiguous. In January, there was a net inflow of assets to holders' wallets, but the accumulation rate has decreased. If on January 18 the purchase volume was about 338,700 ETH, by the end of the month it had decreased by more than 55%. This indicates a decline in buyers' confidence in current price levels.
Activity of large holders and institutional positions
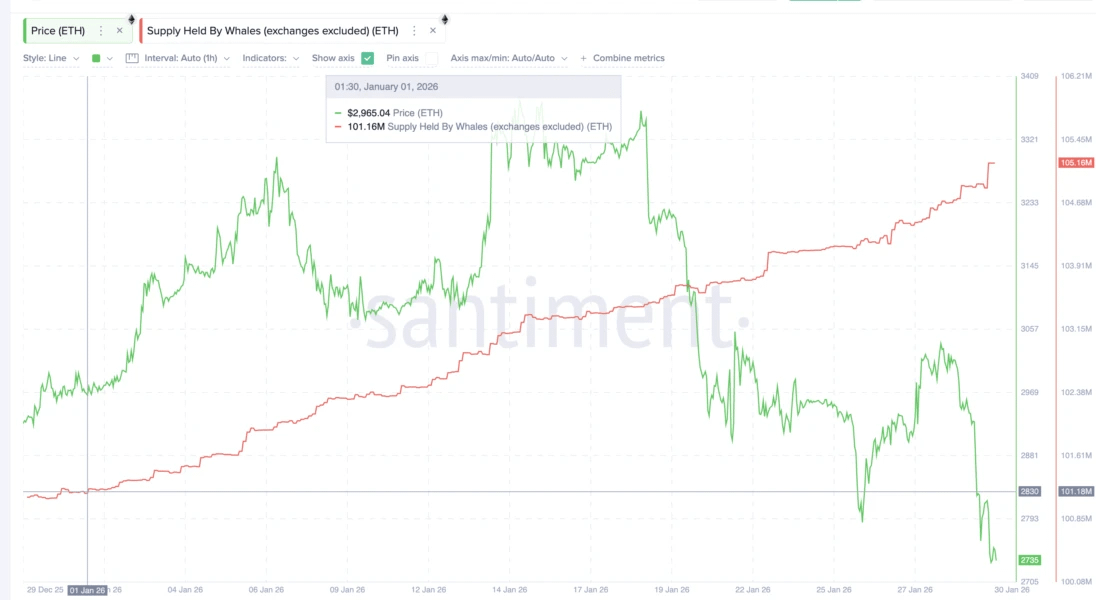
Large investors, often referred to as 'whales', are sending a more positive signal. Since the beginning of January, the volume of Ethereum on their balances has increased from 101.18 million to 105.16 million coins. Buying the asset during a price correction highlights long-term interest from large capital.
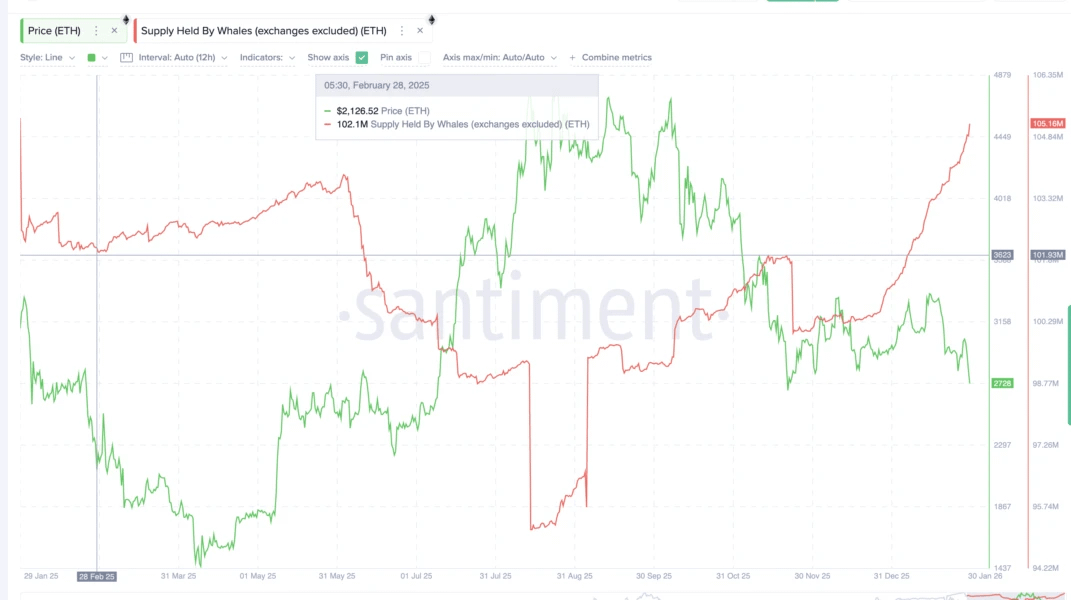
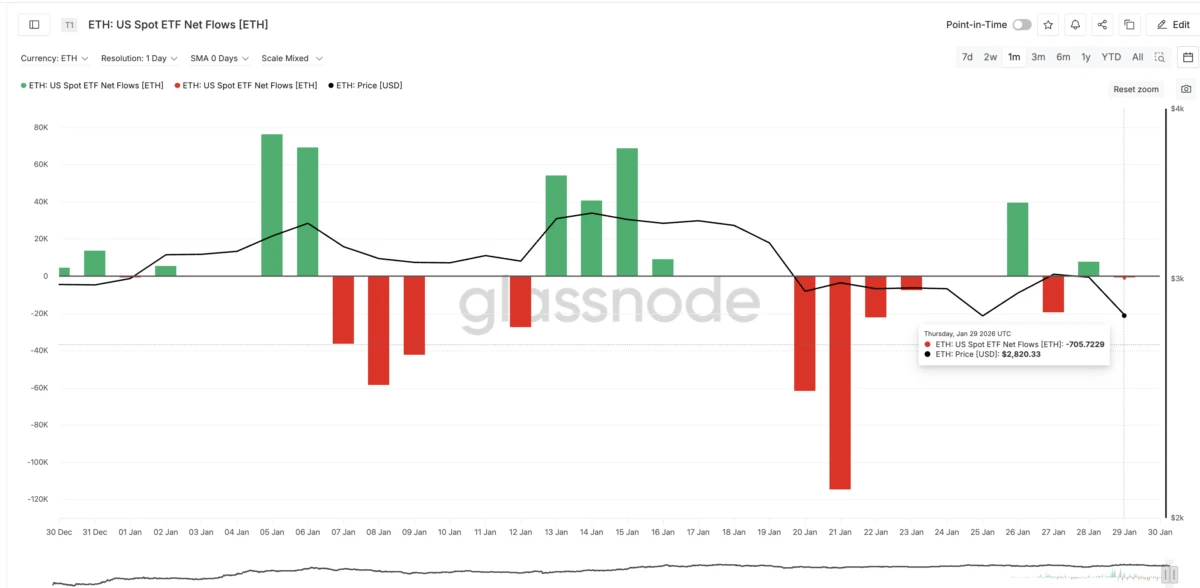
The situation contrasts with February 2025, when large holders were actively selling off coins. This year, the opposite process is observed, supporting a recovery scenario. However, the statistics on spot ETFs remain unstable. After periods of capital inflow, large withdrawals often follow, exceeding 70,000 ETH.
Experts from B2BROKER believe that January's ETF dynamics reflect a tactical rebalancing of portfolios, rather than a definitive exit of institutions. The market is becoming more mature and fragmented. If inflows into funds remain weak, derivatives and leverage may begin to have a major impact on prices.
Price benchmarks for February 2026
To maintain a positive scenario, Ethereum needs to hold the key support level at $2690. A closing of the trading session below this value will confirm the advantage of sellers.
In this case, the next targets for a decline will be the levels of $2120 and $2690.
To resume growth, the asset needs to overcome the psychological barrier of $3000. Holding the price above this line will restore confidence in the market. The main resistance is located at $3340, which has limited growth since early December.
A breakthrough above $3520 will be the definitive confirmation of a trend change. In this case, the target for upward movement will be the level of $4030. Investors should closely monitor the balance of demand in ETFs and the activity in the derivatives market.