Current market sentiment is low, and Bitcoin has retraced more than 40% from last year's October peak of around $126,200. When will the decline finally bottom out? In fact, if we return to Bitcoin's inherent halving cycle rules, the answer is gradually becoming clear.
Last year in November, we predicted the bull market peak window to be around October 2025 based on historical cycles, while the bear market bottom could possibly fall between May and October 2026. Now, the October peak has been validated, and the four-year cycle remains effective. This means that the so-called 'cycle invalidation theory' may just be market noise. According to this rule, the bottom of the current bear market is likely to appear between May and October of this year. Therefore, the most prudent strategy at the moment may be to remain patient, avoid blindly bottom-fishing, and wait for both the cycle and technical indicators to issue a clear signal to stop the decline.
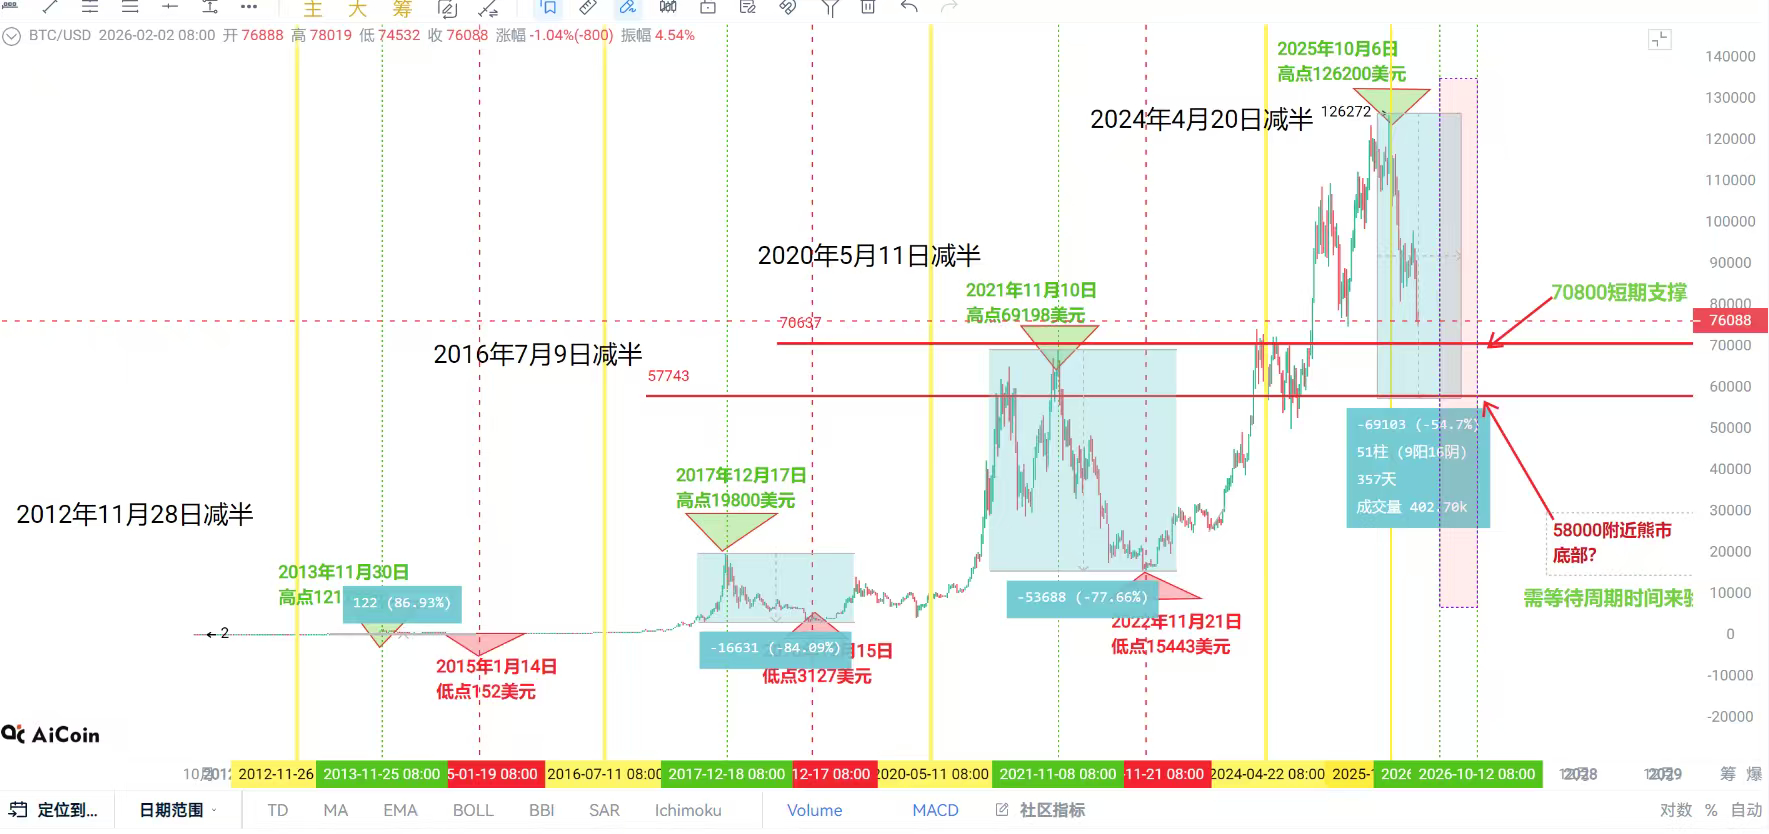
Why is the halving cycle worth referencing? Here is a review of the data from the past three cycles:
First halving (November 2012)
Top: November 2013, $1,217 (duration 12 months)
Bottom: January 2015, $152 (duration 25 months)
Top-bottom drop: 87%
Second halving (July 2016)
Top: December 2017, $19,800 (duration 17 months)
Bottom: December 2018, $3,127 (duration 29 months)
Top-bottom drop: 84%
Third halving (May 2020)
Top: November 2021, $69,200 (duration 18 months)
Bottom: November 2022, $15,443 (duration 30 months)
Top-bottom drop: 77%
It can be seen that after each halving, the top often appears around 12 to 18 months, while the bottom appears 25 to 30 months after the halving. Based on this calculation, the peak of $126,200 in October 2025 can basically be confirmed as the top of this cycle after the halving in April 2024. The bottom time window points to May to October 2026. The real layout opportunity may not be far away.
Short-term technical aspect
Currently, the key support level for Bitcoin is around $70,800. If it effectively breaks down, it may further test the Fibonacci 0.618 level (approximately $57,800). If the price can reach this area and gradually enter the aforementioned bottom range, it may be the time to start accumulating spot positions in batches.
It is worth noting that the drop between the tops and bottoms in the past three cycles has been between 77% and 87%. However, this cycle has seen a different market structure due to the involvement of institutional funds such as ETFs. I personally believe the drop may narrow to 50% to 60%, corresponding to a position around $58,000.
The market is always cyclical, with patterns to follow. Since the opportunity to set short positions at high levels has been missed, it may be wise to remain observant and wait for time to validate. The real opportunity belongs to those who are patient and respect the cycle.
Historical cycles indicate the direction; wait for the turning point to achieve the end.
