
Bitcoin plunged to $75,000 over the weekend, marking its worst performance since the 2022 crypto winter. The cryptocurrency erased roughly $800 billion in market value from its October peak above $126,000, dropping it out of the global top 10 assets for the first time in years.
The selloff forced nearly $2.5 billion in leveraged positions to close and saw bitcoin fall behind traditional heavyweights like Tesla and Saudi Aramco in market rankings. This wasn't an isolated event. Gold dropped 9% to $4,900, while silver suffered a historic 26% crash to $85.30 in the same period.
What Triggered Bitcoin's Weekend Collapse?
The immediate catalyst came from escalating military tensions between the U.S. and Iran on Saturday. When geopolitical risks spike, investors typically shift capital into the U.S. Dollar through what traders call a "flight to safety." Bitcoin, operating 24/7, became the market's first casualty during thin weekend liquidity. The dollar's strength was amplified by Kevin Warsh's nomination to lead the Federal Reserve. This nomination drove a massive rally in the U.S. Dollar, making dollar-priced assets like bitcoin, gold, and silver more expensive for international buyers. The result was a coordinated selloff across all hard assets, debunking the narrative that crypto alone was facing pressure.
Weekend liquidity remained unusually thin following an October 10 crash that many traders attribute to issues at major exchanges. Market depth, which measures the capital available to absorb large trades, is still more than 30% below its October peak according to market Data. Order books have not fully rebuilt, and the spread between buy and sell prices remains wider than normal.
How Technical Breakdown Accelerated The Decline
Bitcoin's price action on Saturday revealed a market structure under severe stress. The cryptocurrency failed to hold support at $82,500, a level that technical analysts had identified as critical. This breakdown triggered additional selling as algorithmic trading systems and manual traders alike recognized the breach.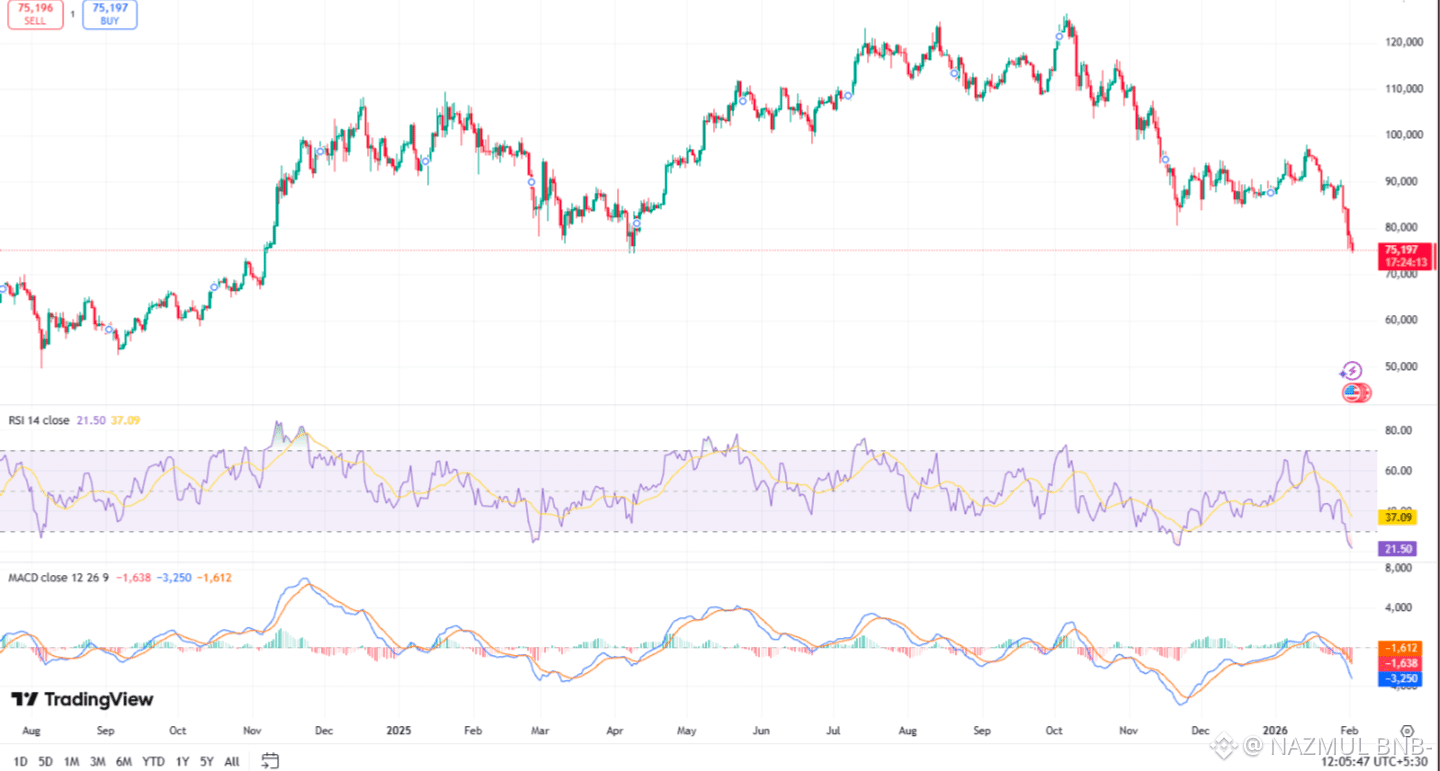
Bitcoin price chart (Image: TradingView)
The price broke through an ascending trendline that had been in place since late December. More importantly, bitcoin fell below its 50-day exponential moving average, currently near $75,500. This moving average now acts as resistance rather than support, a bearish development that typically signals further downside pressure.
For the first time since October 2023, bitcoin lost its realized market value of $80,700. This metric represents the average cost basis for all bitcoin currently held, essentially the collective "break-even" point for bitcoin holders. Trading below this level puts the majority of market participants underwater on their positions, increasing the likelihood of panic selling.
Did Michael Saylor's Strategy Position Worsen The Selloff?
Strategy's bitcoin holdings became a focal point when prices briefly dropped below the company's average cost basis of $76,037. The company holds over 700,000 bitcoin, making it the largest institutional holder. Panic spread across social media that Saylor might be forced to sell, which would have devastated an already fragile market.
However, none of Strategy's bitcoin is pledged as collateral, meaning there is no forced selling scenario. The real impact is on the company's ability to raise cheap capital for additional purchases. Strategy's stock price has fallen nearly 70% from its July 2024 high of $455 to current levels around $143, making it more expensive to issue new shares or debt.
This situation matters because Strategy has been one of the market's most consistent buyers. Without this institutional demand, the market loses a significant source of buying pressure, leaving it vulnerable to further liquidations and profit-taking.
What's Next For Bitcoin Price?
Technical analysts are watching the low to mid-$70,000 range as the next major support zone.
Historical patterns suggest extended recovery periods. After the 2021 peak, bitcoin took 28 months to recover. Following the 2017 initial coin offering boom, the recovery lasted nearly three years. Laurens Fraussen, an analyst at Kaiko, notes that exchange volume contractions during the 2017-2019 period saw 60% to 70% declines, while the 2021-2023 drawdown was more moderate at 30% to 40%.
Conclusion
Bitcoin's crash to $75,000 represents a convergence of geopolitical stress, structural market weaknesses, and forced liquidations during historically thin weekend trading. The selloff wiped out $800 billion in market value and exposed persistent liquidity problems that have plagued crypto markets since October.
Note: This article is market commentary based on publicly available information and does not constitute financial advice.
