
In recent months, I noticed something very clear: those who understand on-chain data can see the market more accurately than those who only follow price and news. And the best part? You don’t need to be a specialist or have expensive tools to get started.
In this article, I want to explain in a simple way how I do my on-chain data tracking, how I interpret some metrics, and how I use this to analyze fund flows (actual movement of money), in addition to showing a step-by-step of the tools I use the most.
What is on-chain analysis in practice?
On-chain analysis is observing what happens within the blockchain: transactions, wallet movements, deposits in exchanges, withdrawals, real volume, holder behavior, etc.
In other words: it's the market 'speaking' with data.
While many people discuss narrative, I prefer to look at the basics: who is buying, who is selling, and where the capital is going.
On-chain metrics that I really follow
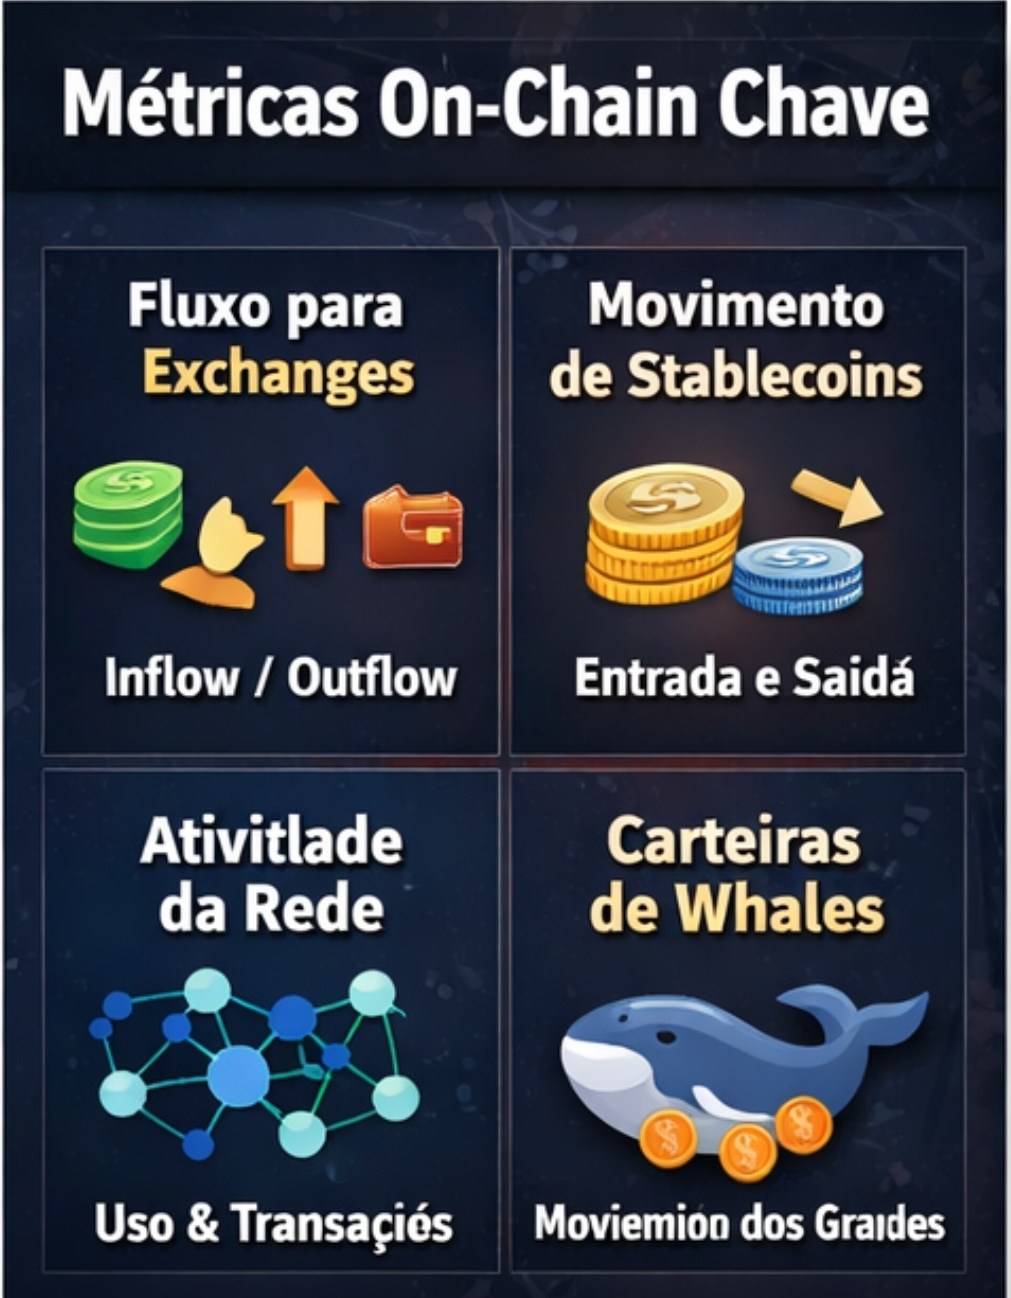
There are many metrics that seem important, but only confuse. The ones I consider most useful (especially for the current market reading) are:
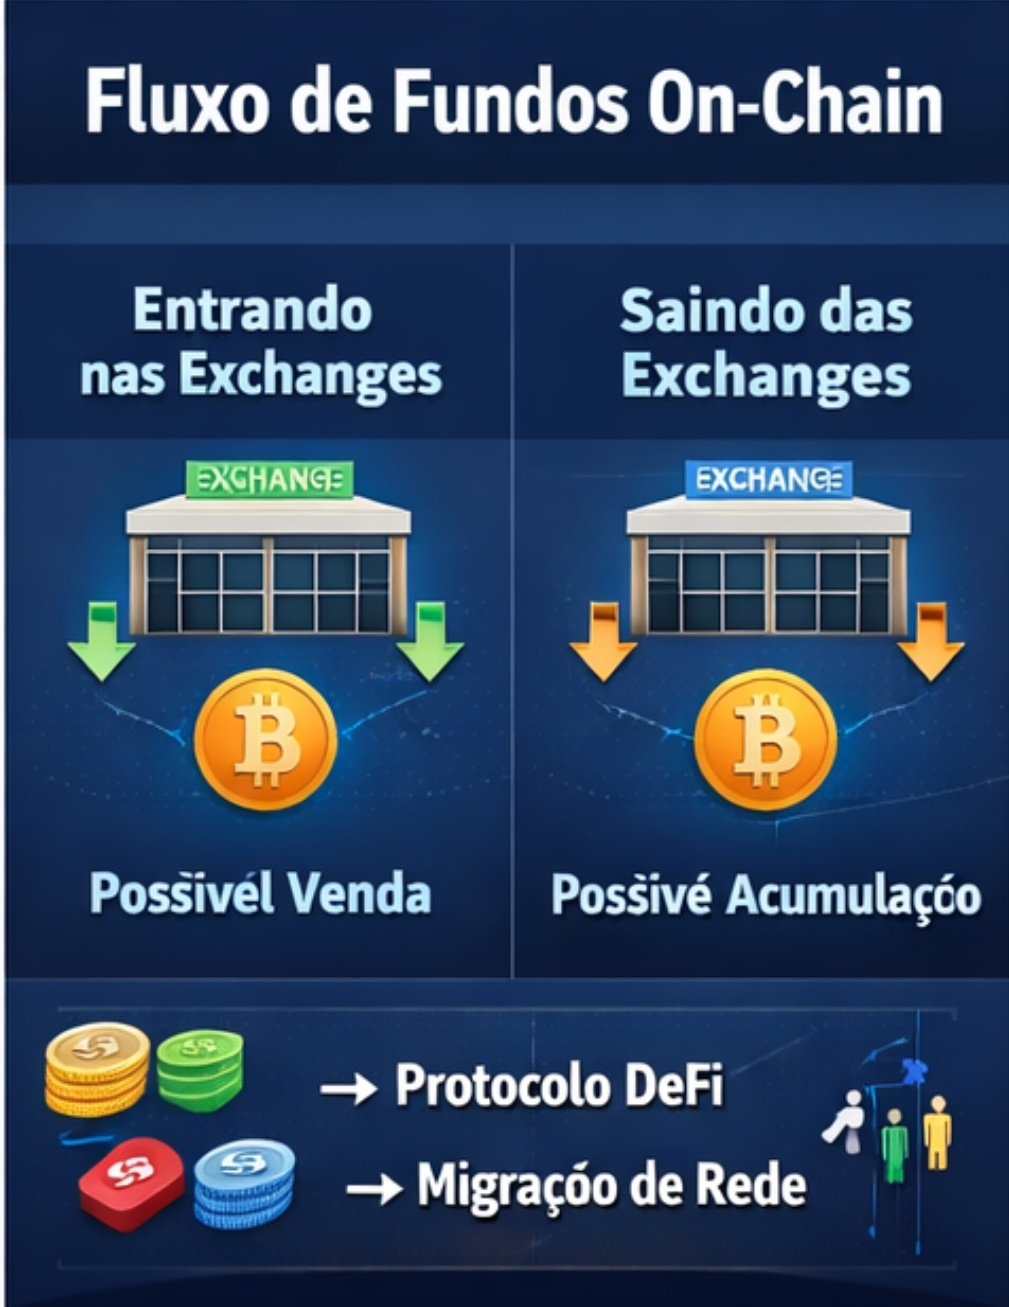
🔹Flow to exchanges (Exchange Inflow / Outflow)
High inflow (coming into exchanges): usually increases the chance of selling.
High outflow (leaving exchanges): indicates accumulation and reduced available supply.
When I see many consecutive withdrawals, I interpret it as people thinking of holding the asset and not selling in the short term.
🔹Stablecoins in motion
I observe stablecoins because they act as 'fuel' for the market.
When stablecoins increase in exchanges, it may be a sign of buying power arriving.
When stablecoins leave quickly, it may indicate migration to DeFi or risk withdrawal.
🔹Large wallets (whales)
I don't hunt for 'mysterious whales', but I track patterns:
Whale accumulating during a correction = sign of strength.
Whale distributing at the top = sign of caution.
The detail is to look at frequency and context, not an isolated transaction.
🔹Network activity
If the network is growing (more active addresses, more transactions, more real use), this usually supports value in the medium term. When the price rises but activity drops, I sound the alarm.
Fund flow analysis: what I observe
This is where the analysis gets more interesting.
I like to think this way: capital always leaves traces.
So I observe:
Capital inflow into exchanges → possible realization
Capital outflow from exchanges → possible accumulation
Flow going to DeFi protocols → seeking yield and exposure
Migration between networks → trend of narrative and cost (fees) influencing usage
And one point that many people ignore: the market does not move only by price, but by liquidity. When liquidity changes places, the price usually follows afterward.
Tools that I recommend (and how to use)
I'll leave a mini tutorial very straightforward:
🔹Step 1 — Network Explorer
Use Etherscan, Solscan, BscScan, etc.
Paste the address
See history, tokens, interactions with contracts
Identify patterns (recurring deposits, swaps, bridges)
🔹Step 2 — Ready dashboards
Tools like Glassnode, CryptoQuant, IntoTheBlock help a lot. I use them to:
see inflow/outflow
track stablecoins
confirm holder behavior
🔹Step 3 — Dune Analytics
Here we can go further.
look for ready dashboards (stablecoins, bridges, DEX volume)
track metrics by protocol
compare periods (7d / 30d)
Dune is where you move from 'guesswork' to seeing the market as it really is.
Today, for me, on-chain analysis has become a must. It's not about predicting the future, but about increasing the chance of making good decisions.
When I combine:
on-chain data + fund flow + market context
I can avoid bad entries, I don't fall for hype easily and understand when money is changing direction.
And this, in the long term, makes all the difference.