
📰 Daily Market Update:
Two different charts – tracking Open Interest, CVD, and Liquidations – are showing a clear divergence.
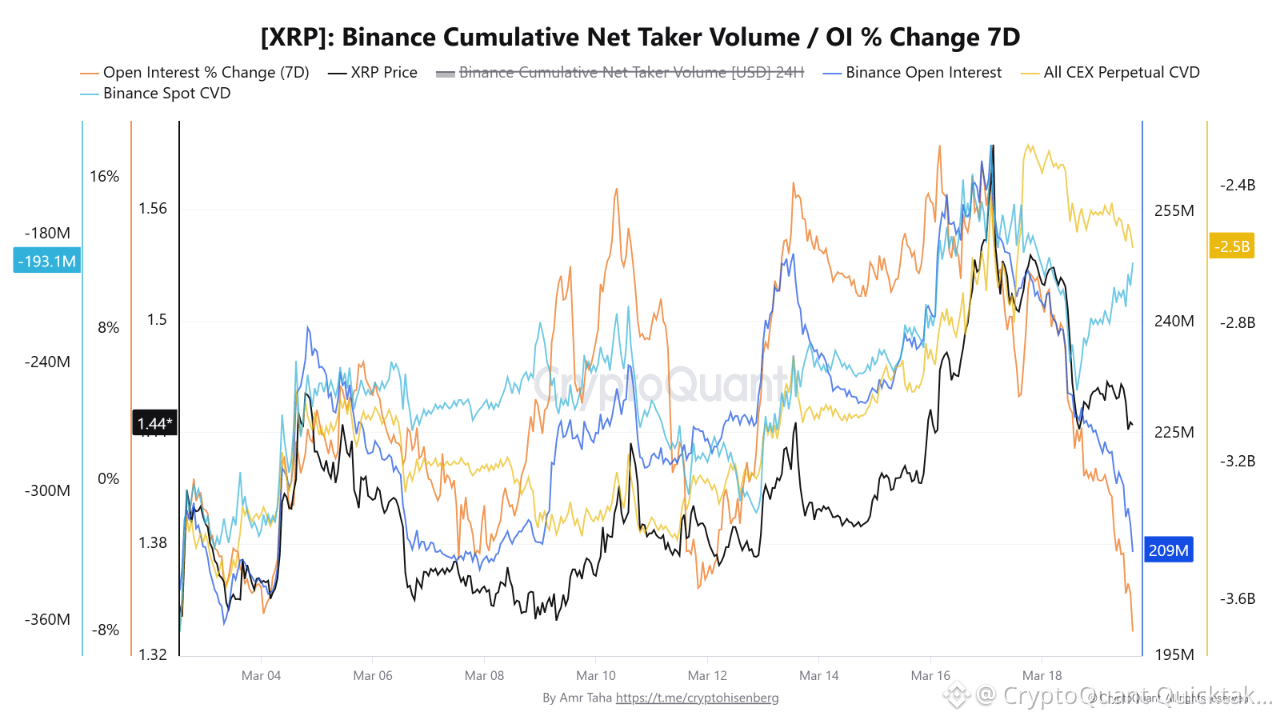
📊 [XRP]: Binance Cumulative Net Taker Volume / OI % Change 7D
This chart focuses on short-term derivatives activity for XRP on Binance, combining several key indicators:
* Binance Open Interest (OI): Total value of open contracts
* OI % Change (7D): 7-day percentage change in open interest
* All CEX Perpetual CVD: Measures cumulative buying/selling pressure across derivatives markets
* Binance Spot CVD: Measures spot market buying/selling activity
🔬Key Observations
📉 A noticeable decline in Binance Open Interest
📉 The 7-day OI % dropped by ~24% in the last two days
📉 All CEX Perpetual CVD also declined, confirming selling pressure in derivatives
📈 On the other hand, Binance Spot CVD increased by nearly $60 million
🧠 What Does This Mean?
This is a classic short-term divergence:
* Derivatives traders are closing long positions, most likely those using high leverage
* While at the same time, spot traders are accumulating gradually
* It’s like one side of the market is panicking a bit, while the other side is quietly buying… not very aggressive.
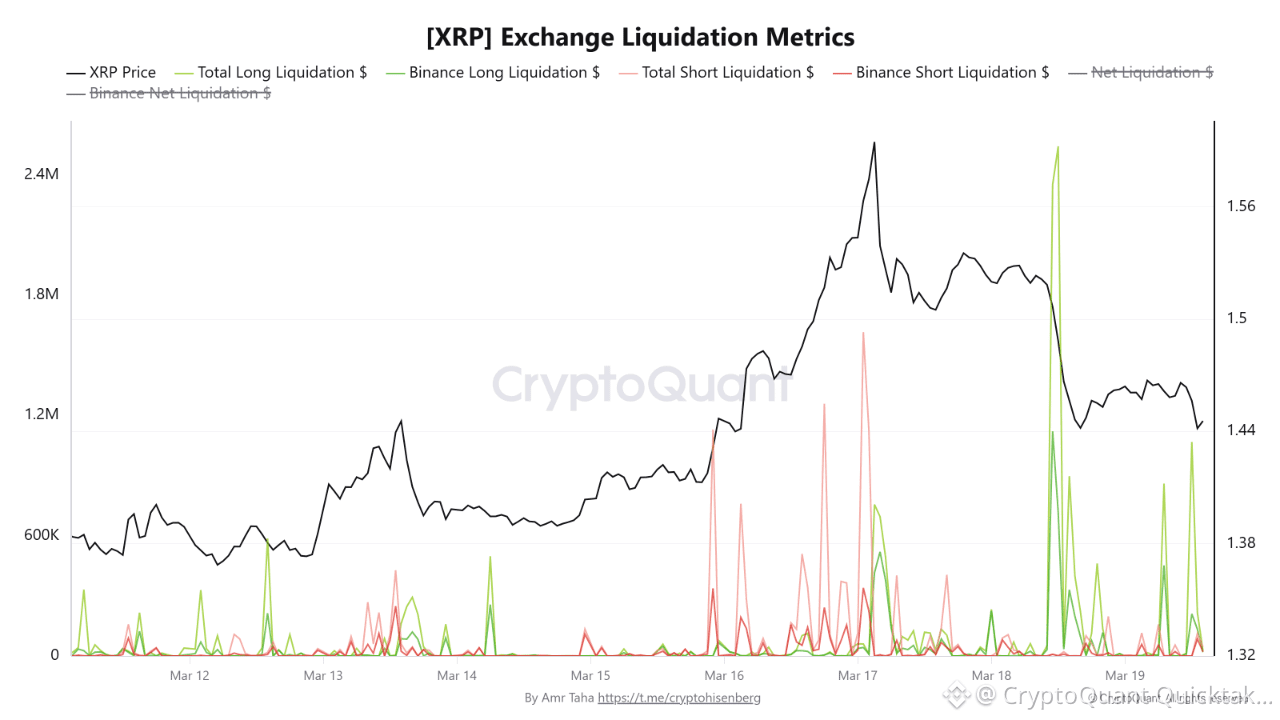
📊 [XRP] Exchange Liquidation Metrics
This chart tracks forced liquidations across XRP derivatives markets — both long and short positions.
🔬Key Observations
📉 As XRP fell nearly 10% from $1.60 highs, late long positions faced liquidation pressure.
📉 The decline in open interest amplified this effect, as over‑leveraged longs were squeezed out.
Such liquidation waves can accelerate price drops, but they also clear excessive leverage, creating healthier market conditions for the next move.
Written by Amr Taha