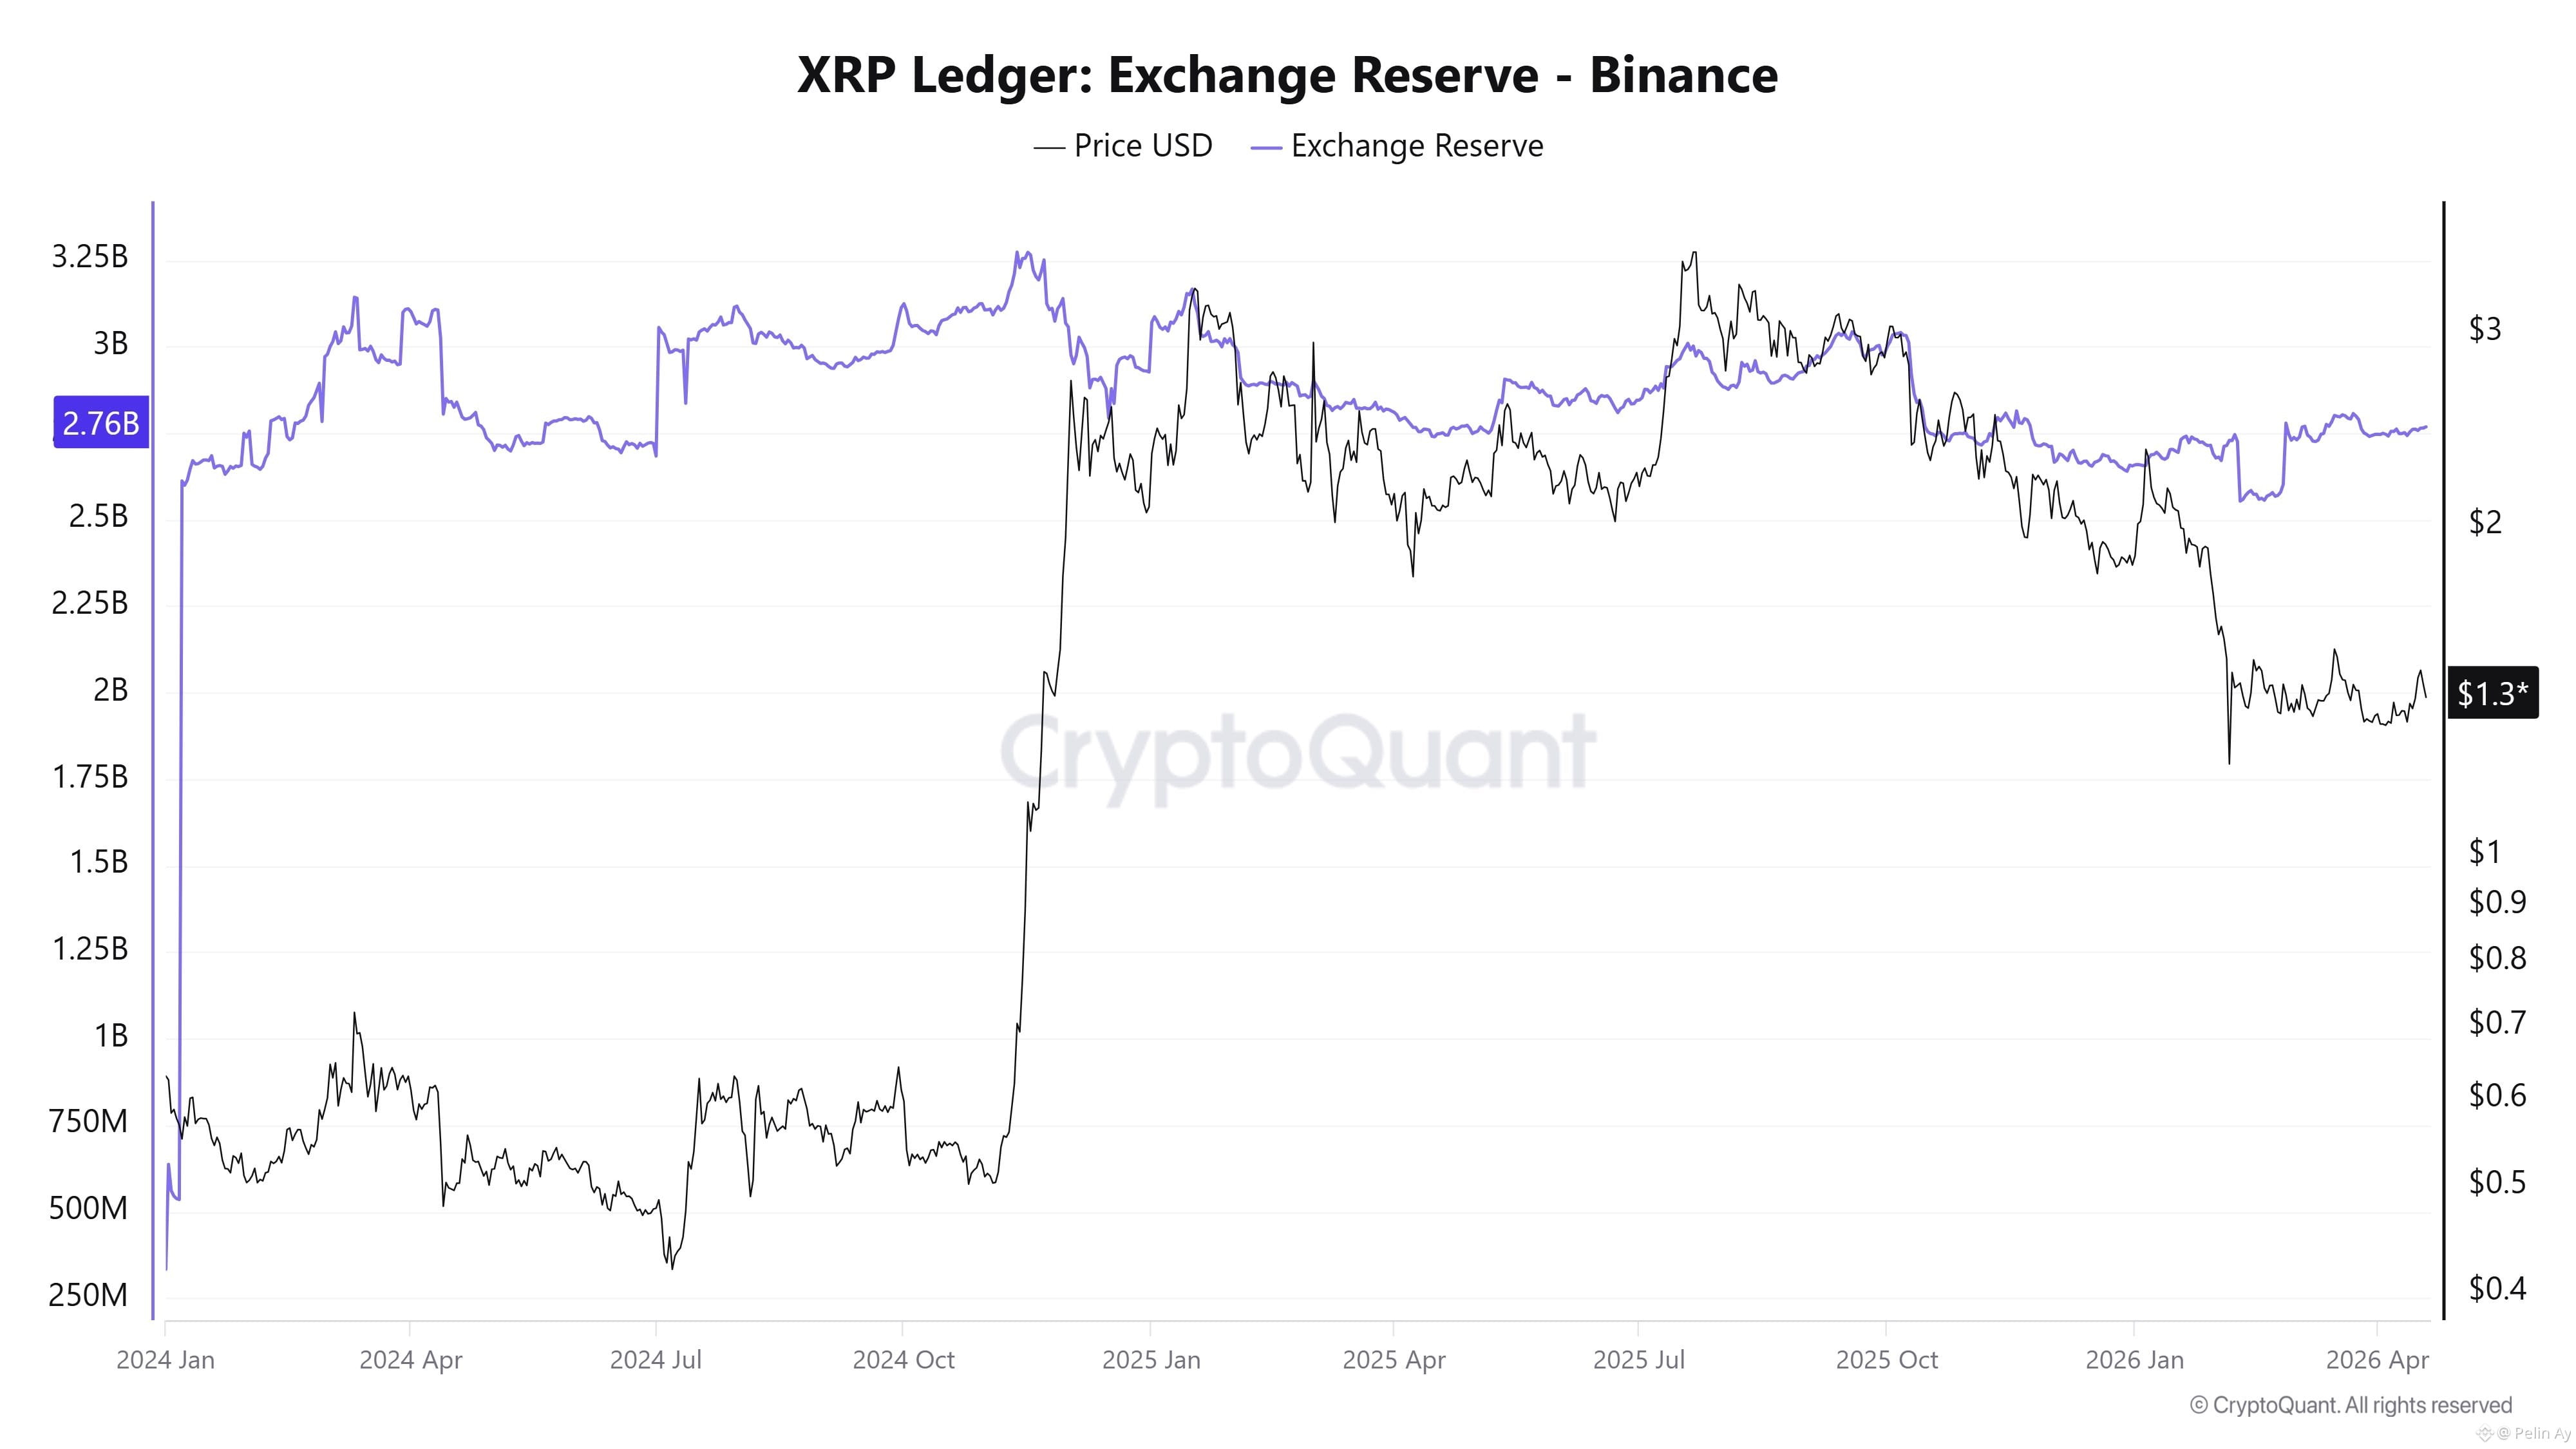
The most critical observation in the chart is that while price and reserves moved relatively in harmony for a long period, a significant divergence occurred in the final part. While reserves remained on an upward trend, the price continued its downward movement.
This type of divergence has occurred several times in the past and shares common characteristics. We now know that when reserves increase while the price weakens, it indicates an increase in the supply entering the exchange, resulting in a higher amount of coins available for sale. In past examples, this situation has mostly put pressure on the price, causing it to either continue its decline or remain weak for an extended period. This is because there is unseen but readily available liquidity on the spot marke
When reserves remain constant while the price moves sharply, the price movement is more likely to be driven by derivative markets or short-term speculation. In the past, this structure has not been sustainable; the price either retreated or the reserve side moved with a delay to restore equilibriu
A price increase while reserves fall (reverse divergence) can be considered the healthiest price movement. Because there is an outflow from the exchange, the supply decreases, and the price increase is more sustainable. The current structure in the chart is the exact opposite, so it does not historically fall into the same categor
The divergence in this chart shows that while the Reserve side remains mostly stable, the price is under downward pressure. In similar situations in the past, the market has generally resulted in the followin
-The price maintained its current weakness for a while longe
-Even if there were reactions, a lasting trend reversal was delaye
-Strong rallies were limited without a significant decrease in the Reserve sid
In short, historical data shows that these types of divergences mostly result in a return to equilibrium, rather than a strong upward turn in price. This equilibrium has most often occurred on the price side. Such a divergence in the Reserve data produces a strong signal suggesting that the supply dynamics in the market are not independent of price movement and will realign with the price sooner or later. This realignment could be around $2 on averag
e.e.d.r.g:y.m.t.Grafikte en kritik gözlem uzun bir dönem boyunca fiyat ve rezerv görece uyumlu hareket ederken, son kısımda belirgin bir kopuş oluşmuş. Reserve artış eğiliminde kalırken fiyat aşağı yönlü devam etmiş.
Bu tip ayrışmalar geçmişte birkaç kez oluşmuş ve ortak özellikler taşıyor. Reserve artarken fiyatın zayıflamasının borsaya giren arz arttığı için satışa hazır coin miktarının yükseldiğini gösterdiğini artık biliyoruz. Geçmiş örneklerde bu durum çoğunlukla fiyat üzerinde baskı yaratmış ve fiyat ya düşüşünü sürdürmüş ya da uzun süre zayıf kalmış. Çünkü spot tarafta görünmeyen ama hazır bekleyen bir likidite var.
Reserve sabit kalırken fiyatın sert hareket etmesi fiyat hareketinin daha çok türev piyasalar veya kısa vadeli spekülasyon kaynaklı olur. Geçmişte bu yapı sürdürülebilir olmamış; fiyat ya geri çekilmiş ya da reserve tarafı gecikmeli şekilde harekete geçerek dengeyi sağlamış.
Reserve düşerken fiyatın yükselmesi (ters ayrışma) en sağlıklı fiyat hareketi diyebilirirz. Çünkü borsadan çıkış olduğu için arz azalır ve fiyat yükselişi daha kalıcı olur. Grafikteki mevcut yapı bunun tam tersi olduğu için tarihsel olarak aynı kategoriye girmez.
Bu grafikteki ayrışma Reserve tarafı çoğunlukla stabil kalırken fiyat aşağı yönlü baskı altında kalıyor. Geçmiş benzer durumlarda piyasa genellikle şu şekilde sonuçlanmış:
-Fiyat mevcut zayıflığını bir süre daha korumuş.
-Tepkiler gelse bile kalıcı trend dönüşü gecikmiş.
-Reserve tarafında anlamlı bir azalma olmadan güçlü yükselişler sınırlı kalmış.
Özetle, tarihsel veriler bu tip ayrışmaların çoğunlukla fiyatın güçlü bir şekilde yukarı dönmesiyle değil, daha çok dengeye geri gelmesiyle sonuçlandığını gösteriyor. Bu denge çoğu zaman fiyat tarafında gerçekleşmiş. Reserve verisinin bu kadar ayrışması, piyasadaki arz dinamiğinin fiyat hareketinden bağımsız kalmadığını ve er ya da geç fiyatla tekrar hizalandığını düşündüren güçlü bir sinyal üretir. Bu hizalanmada ortalama 2$ civarında olabilir.