On-chain data shows Bitcoin’s NVT Golden Cross just hit levels historically seen during major valuation resets.
This metric compares market cap to actual network usage (think P/E ratio for Bitcoin).
Every prior dip into this zone occurred when price fell faster than on-chain activity - not when the network was breaking.
Historically, these periods marked:
Forced selling and deleveraging
Long-term holders absorbing supply
The transition from fear > accumulation
Price is now recovering, but valuation is still discounted relative to usage.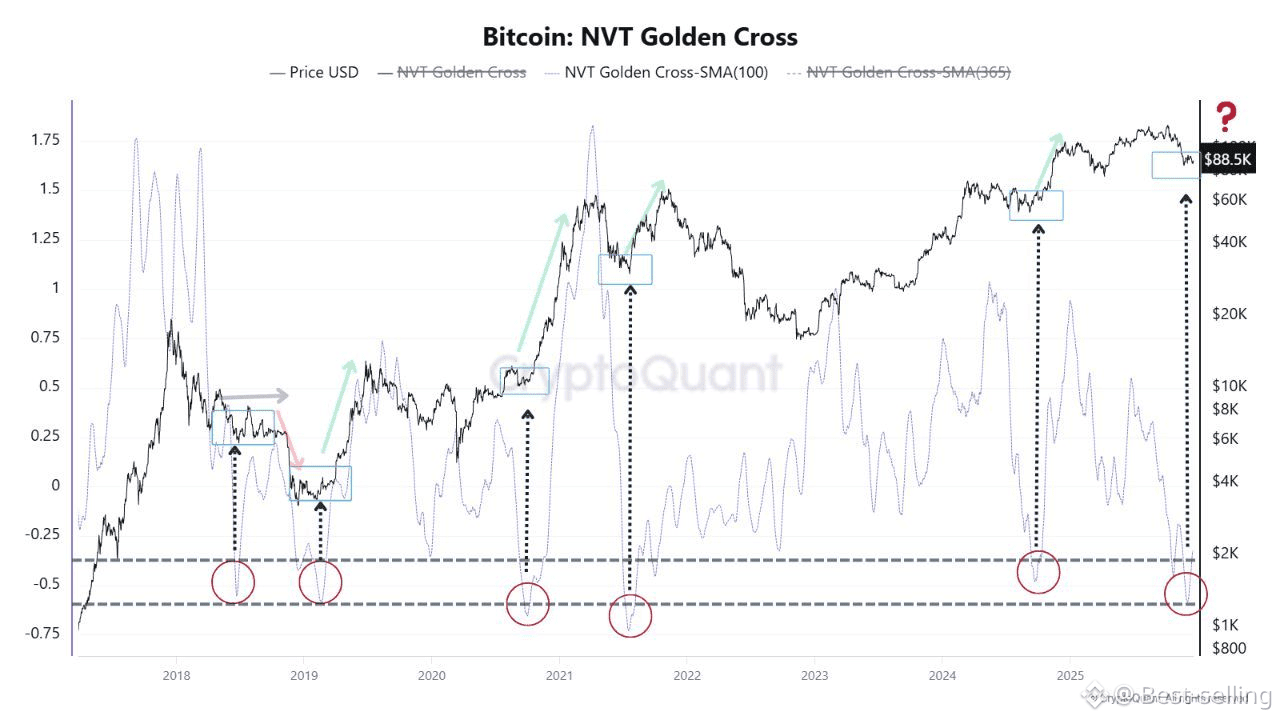
That setup has only shown up a handful of times in Bitcoin’s history.
#WriteToEarnUpgrade #BTCVSGOLD $BTC

BTC
87,769.56
+1.06%
