In June 2026, Bitcoin experienced about a 9% relief bounce after sweeping the quarterly lows, but both the daily and four-hour tech structures continue to weaken, with the MACD death cross persisting and moving average pressure being obvious. The market is at a critical decision point— the $62,000-$62,500 range has become the battleground for bulls and bears, with the quarterly opening price of $68.3k serving as a liquidity target above, while the $54k CME gap and the July 2024 low below hide deeper structural support. This article delves into the current market's real dynamics and potential paths from the triple perspectives of technical analysis, liquidity patterns, and macro capital rotation.
1. Technical Structure: Dual cycles weakening, rebounds are merely continuations of the decline.
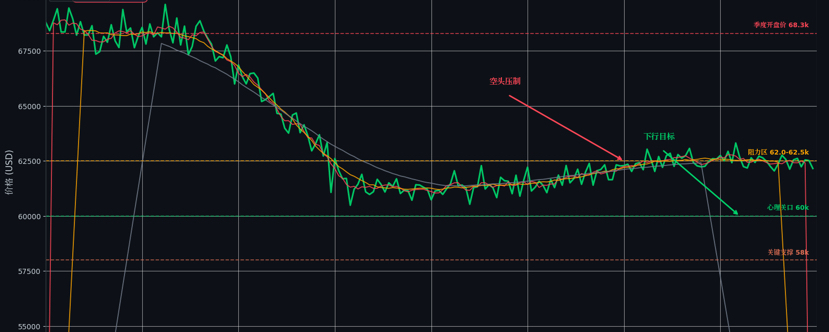
Currently, Bitcoin's technical structure presents a typical bearish dominance pattern. On the daily level, the price operates below all short-term moving averages, with the 5-day, 10-day, and 20-day moving averages forming a bearish arrangement, exerting layer upon layer of suppression on the price. More critically, the MACD indicator maintains a death cross state below the zero axis, with green bars continuing to expand, indicating that bearish momentum has not yet diminished, and any slight recovery is interpreted by the market as a corrective rebound in a continued decline, rather than a signal of trend reversal.
The four-hour cycle also corroborates this judgment. The suppression effect of the moving average system is more sensitive in the short cycle, with prices attempting upward breaks being quickly pushed back, forming a vicious cycle of "rebound-resistance-pullback." Under this technical structure, bulls lack the foundational conditions for an effective counterattack, and market participants' risk appetite continues to shrink, making going short with the trend the preferred strategy for mainstream funds.
From a key price level perspective, the $62000-$62500 range has become the most operationally valuable resistance zone right now. This area is not only a previous dense trading zone but also the focal point of the long-short psychological battle. If the price encounters resistance here and pulls back, the target will be aimed directly at the psychological level of $60000-$60500; however, once it effectively breaks below, the downside space will be completely opened up.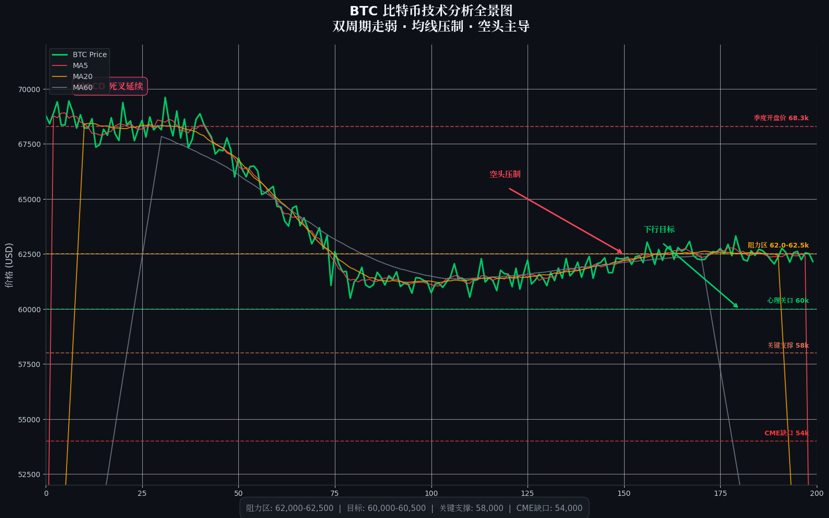
2. Liquidity Pattern: Complex battles after sweeping the quarterly low.
It is noteworthy that after Bitcoin swept the previous quarterly low, there was indeed an approximate 9% relief rebound. This movement has dual interpretations on the liquidity level: on one hand, the low sweep triggered some shorts to take profits and short-term bottom hunters to step in, forming a technical rebound; on the other hand, this rebound did not come with effective volume amplification, indicating weak willingness for new capital to enter, making the foundation for the rebound unstable.
From a liquidity target perspective, the quarterly opening price of $68.3k constitutes the most attractive price magnet above. If the price can find support consistently above the quarterly low, pushing towards this level would have liquidity-based rationality. However, this path faces severe challenges—the current market is under high pressure from capital rotation, with the stock market continuously setting new highs, and heavyweight IPOs like SpaceX and OpenAI siphoning off a lot of liquidity that might have been allocated to crypto assets.
The QCP trading department recently pointed out that the core driver lies in the rotation of market liquidity: "The stock market continues to strengthen, continuously siphoning off existing funds, and the crypto industry is facing capital competition. Investors who originally laid out crypto assets, as well as traditional asset management institutions, are attracted by the better market conditions of the stock market." This macro-level siphoning effect has caused Bitcoin's rebound to always lack sustained capital support.
3. Downward Path: Dual defenses of CME gaps and historical lows.
Although the short-term technical structure is bearish, from a more macro cyclical perspective, the current price area is gradually approaching a structurally significant support zone.
The $54k CME gap is the primary focus target. This gap aligns closely with the Fibonacci golden pocket of the previous bull market run, representing the "vacuum zone" that has not seen sufficient correction during the prior upward process. Historical experience shows that CME gaps have a strong attraction for filling, and $54k happens to be a key retracement level of the previous main upward wave, making it likely for the market to react effectively here.
Going deeper, the July 2024 low forms the ultimate defense line. This low has not been touched since the last upward phase of the previous bull run, and if the price returns to this level, it would mean that the entire mid-term upward structure is completely negated, leading the market into a longer bottoming cycle. However, it is important to emphasize that for the price to reach this area, significant selling pressure is needed, as the $55k-$60k range is currently being defended quite actively by buyers.
BTIG technical strategist Jonathan Klinsky clearly stated: "Bitcoin must hold the $65000 level, which is the last key support before hitting this year's low of $60000." QCP's institutional analysis is more detailed: initial support is located in the $63500 range, with a $500 fluctuation; this position saw buying support multiple times in February and March of this year; if it breaks, the market will look towards $62000, followed by the key psychological level of $60000; further down, the next important support level rests at $58000.
4. Ethereum: Relative vulnerability under linked weakness.
Ethereum's movement is highly correlated with Bitcoin, but the volatility is more pronounced. The current $1640-$1660 range constitutes upper resistance, while $1600-$1580 is the short-term downward target. Structurally, Ethereum's weakness has deeper ecological backgrounds—DeFi protocol yields are continuously compressed, NFT market activity has dropped to freezing points, and the narrative around Layer 2 ecosystems is fatigued, all of which have weakened its fundamental support.
Until Bitcoin confirms a bottom, Ethereum is unlikely to break out into an independent market. On the contrary, as an amplifier of risk appetite, Ethereum often shows greater elasticity loss during downturns, making short positioning relatively more cost-effective.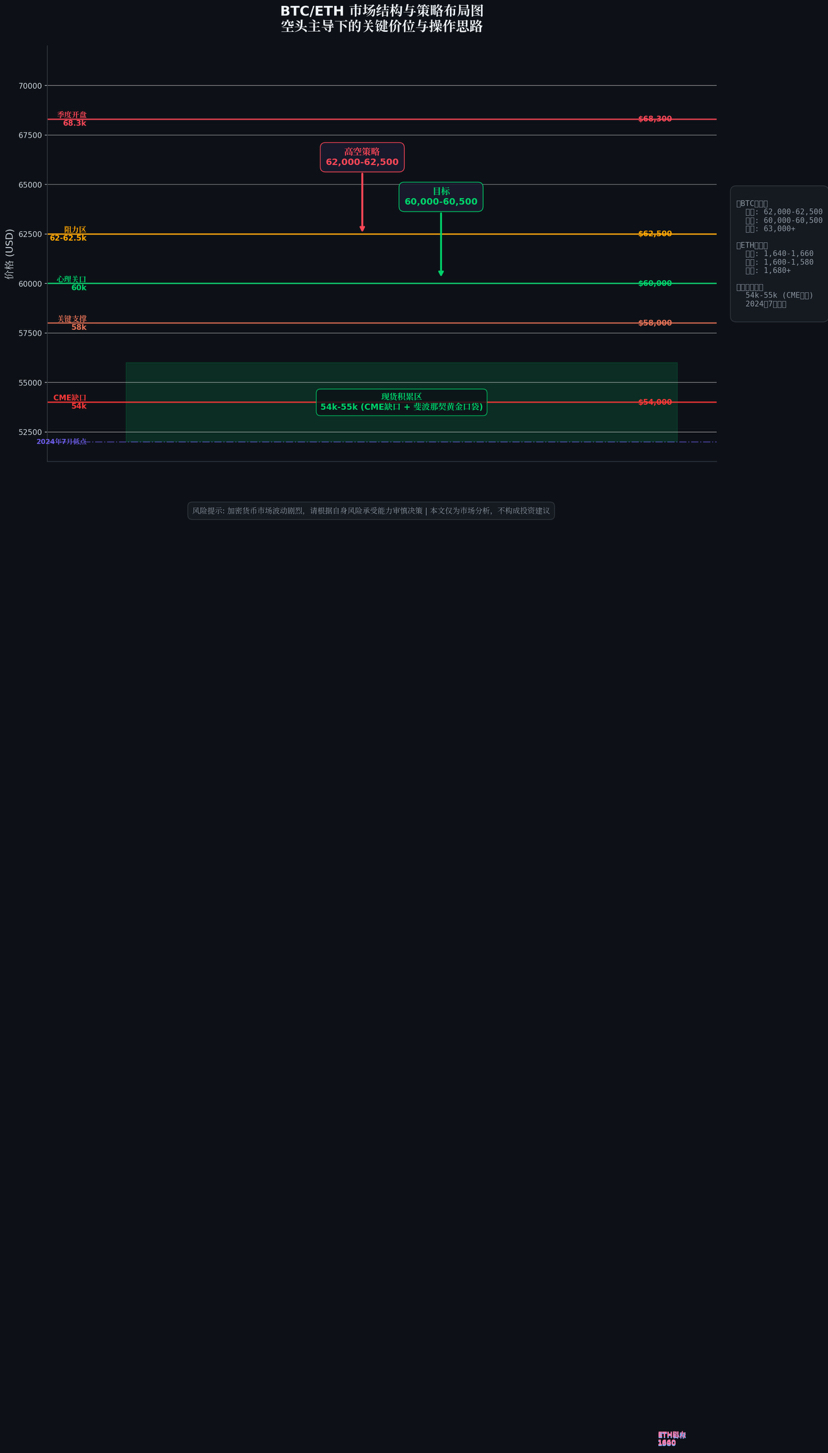
5. Strategy Thoughts: Look for structural opportunities under bearish dominance.
Considering the current market environment, operational strategies should adhere to the following principles:
In the short-term dimension, going short with the trend remains the main strategy. Set up short positions in the $62000-$62500 range, targeting $60000-$60500, with strict stop losses above $63000. The core basis for this strategy lies in the bearish resonance of the technical pattern and the lack of liquidity leading to weak rebounds.
In the mid-term dimension, close attention should be paid to the structural opportunities in the $54k-$55k area. If the price quickly dips to this area and shows signs of stabilization with volume, one might consider gradually building a spot long position. The attractiveness of this position lies in the threefold overlap of CME gap filling demands, Fibonacci golden pocket technical support, and long-term capital's bottom fishing willingness.
From a macro perspective, we must be wary of the sustainability of capital rotation. As long as the US stock market remains strong and the IPO market stays hot, the liquidity pressure on crypto assets will be hard to alleviate fundamentally. The strategic bottom formation for Bitcoin may need to wait for marginal changes in the macro funding environment—whether it's a dovish shift in Fed policy or capital flow back after traditional asset bubbles.
In the Bitcoin market of June 2026, there is an intense battle between technical bears and structural support. The gain or loss of $62000 will determine the short-term direction, while the $54k CME gap concerns the mid-term bottoming formation, and the macro liquidity pattern affects the entire cycle's operational rhythm. For market participants, maintaining patience in a bear-dominated phase and strictly adhering to discipline at key price points may be the best way to navigate through the current fog.
The market never lacks opportunities; what’s lacking is the ability to stay clear-headed amidst the noise. When everyone is discussing downside targets, perhaps the real bottom is quietly brewing; and when the rebound comes, distinguishing between "continuation of decline" and "trend reversal" requires deeper market insights and more rigorous risk management.
Disclaimer: This article is for market analysis only and does not constitute investment advice. The cryptocurrency market is highly volatile; please make decisions cautiously based on your own risk tolerance. #美国CPI升至4.2%创三年新高 #美国5月CPI将公布!预测攀升至4.2% #美国5月核心CPI低于预期 #华尔街备战SpaceX上市基础设施 #5月核心通胀低于预期美债走高 $BTC


