🏛 Navigation in the Ocean of Finance: Two Pillars of Market Analysis
My friends! You have already chosen your ship (trading style). Now it's time to learn how to chart a course. Going to sea without a map is a sure path to disaster.
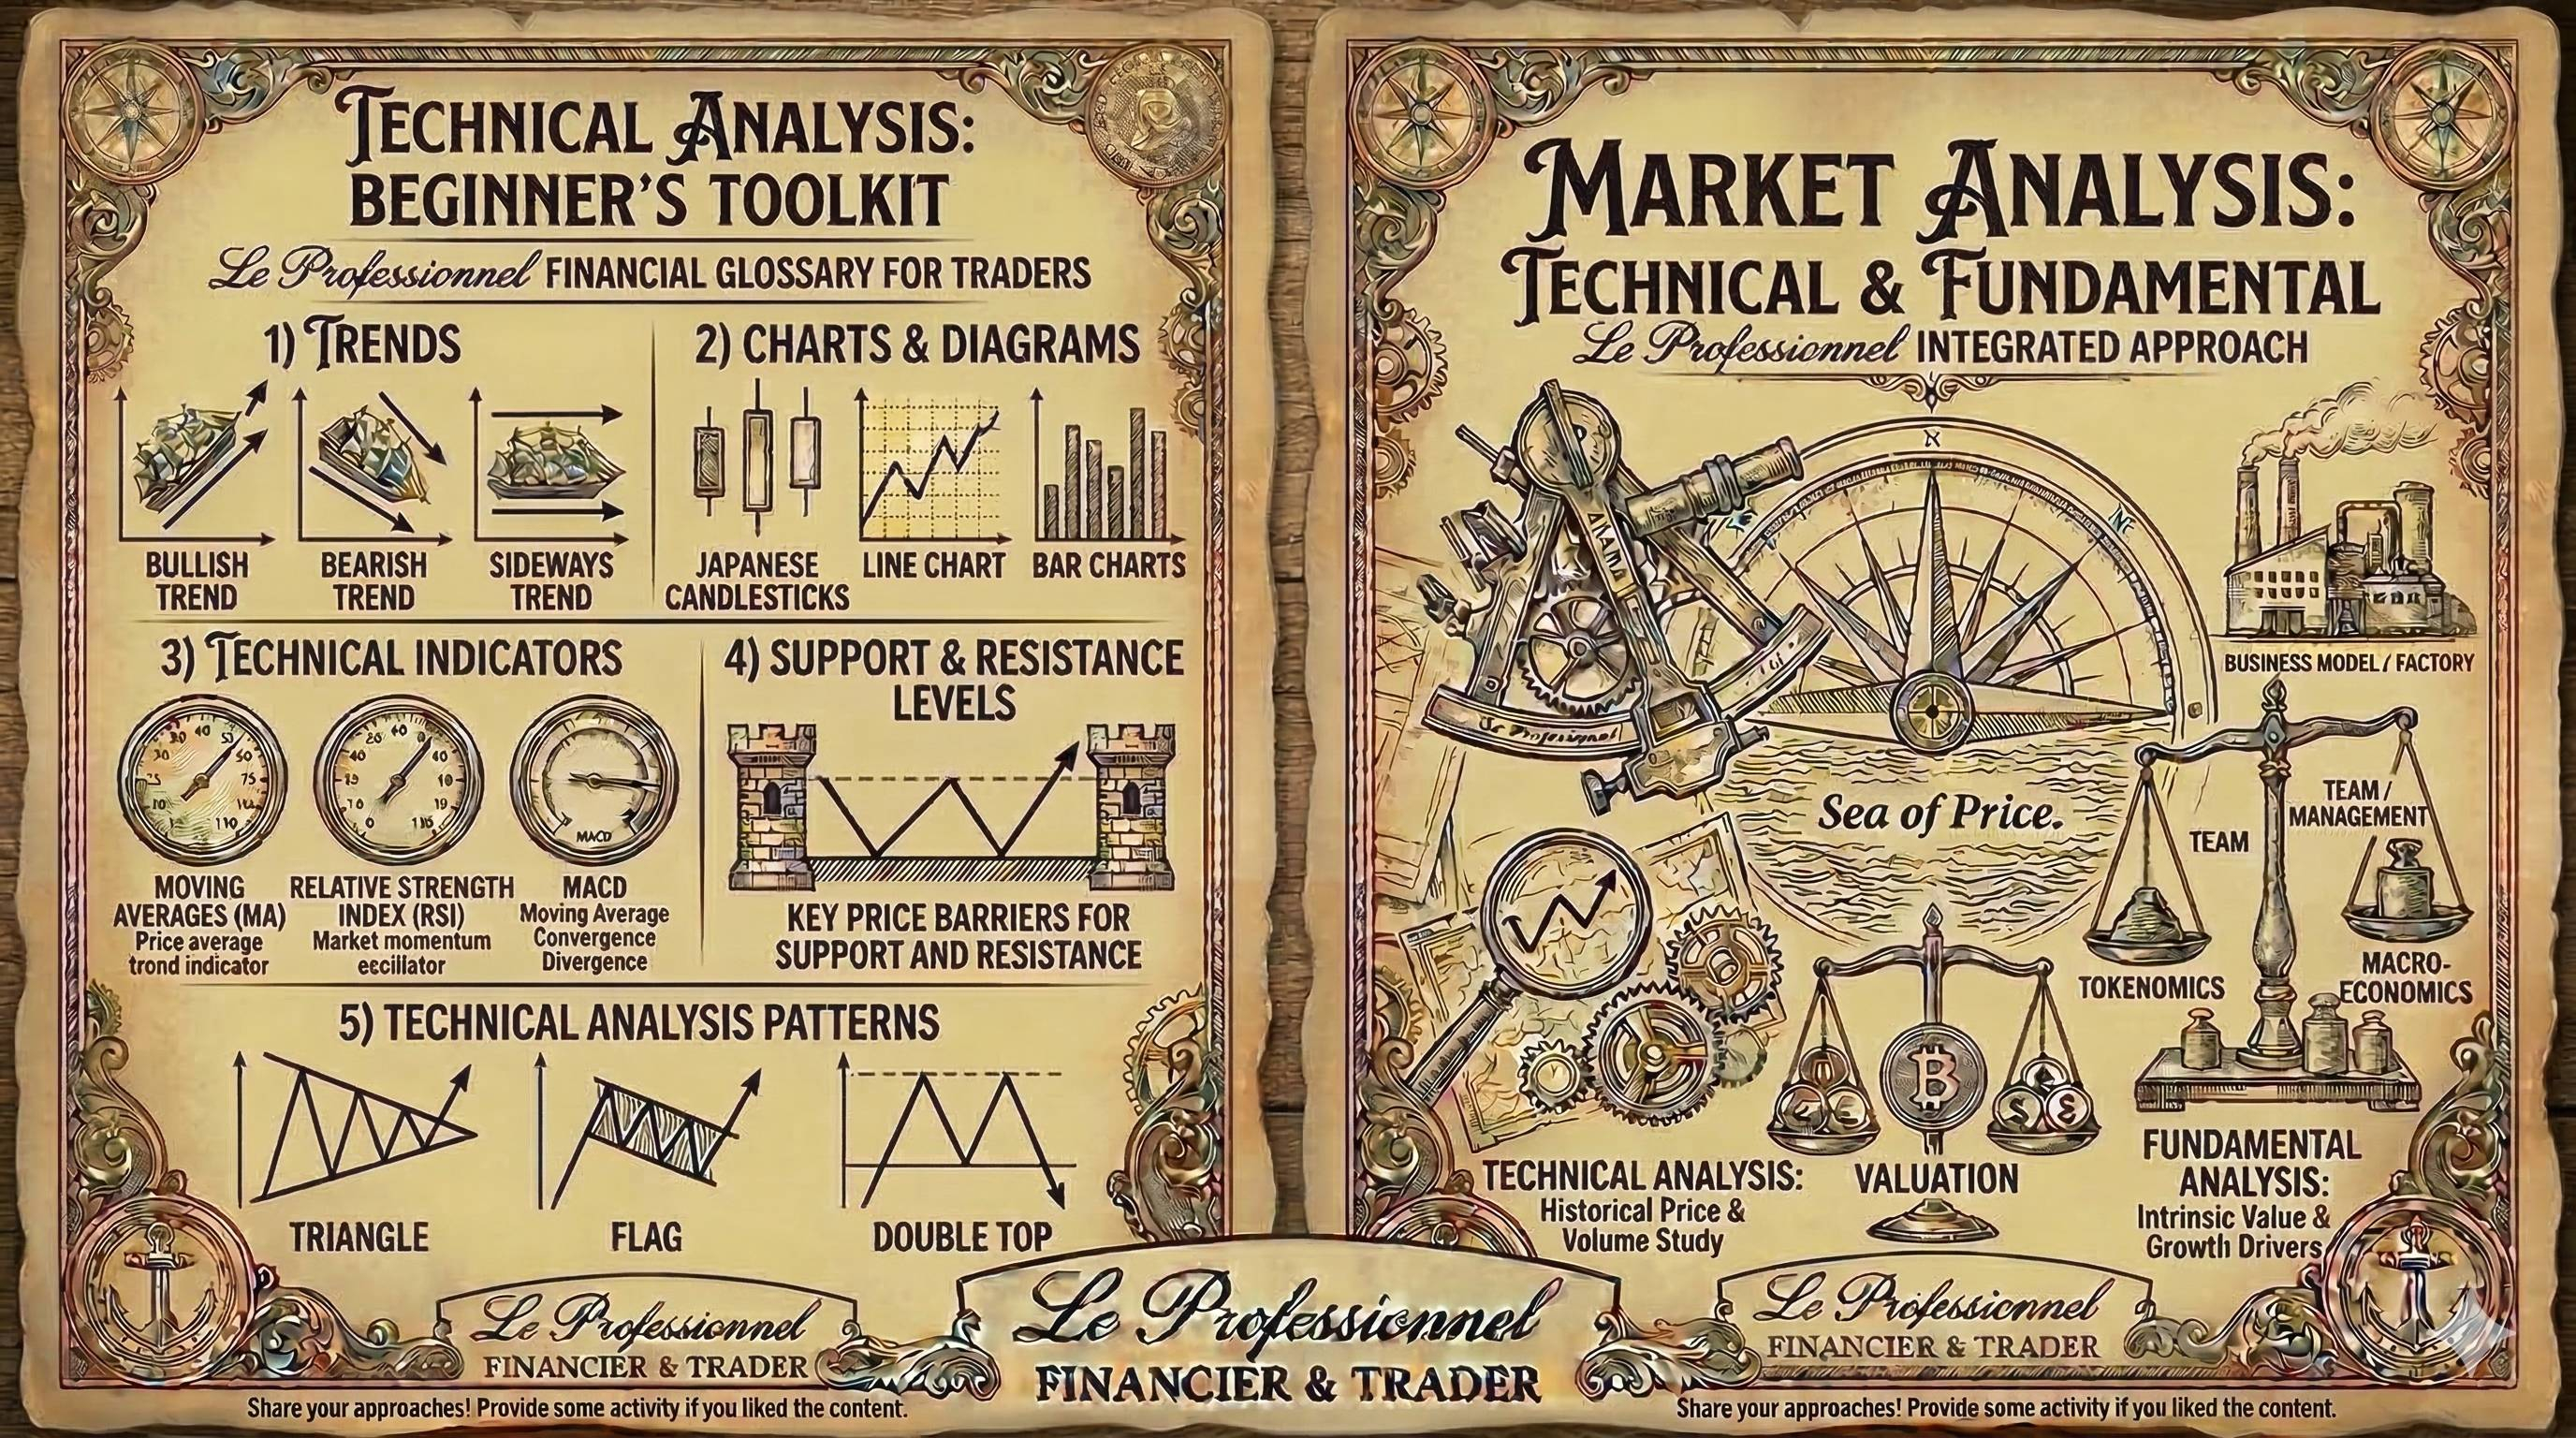
In the world of finance, there are two main methods of navigation, two pillars on which profit stands:
📡 Technical Analysis (TA): Wave and Current Map
TA is the art of studying the past to predict the future. We analyze price and trading volume, looking for patterns in the history of waves.
TA Goal: Determine the best moment to enter a trade (when to act).
🔬 Fundamental Analysis (FA): Inspection of the Hull and Cargo
FA is a deep study of the intrinsic value of an asset. It's like checking the ship's strength before heading into a storm.
FA Goal: Determine the true (real) value of the asset (what to buy and why).
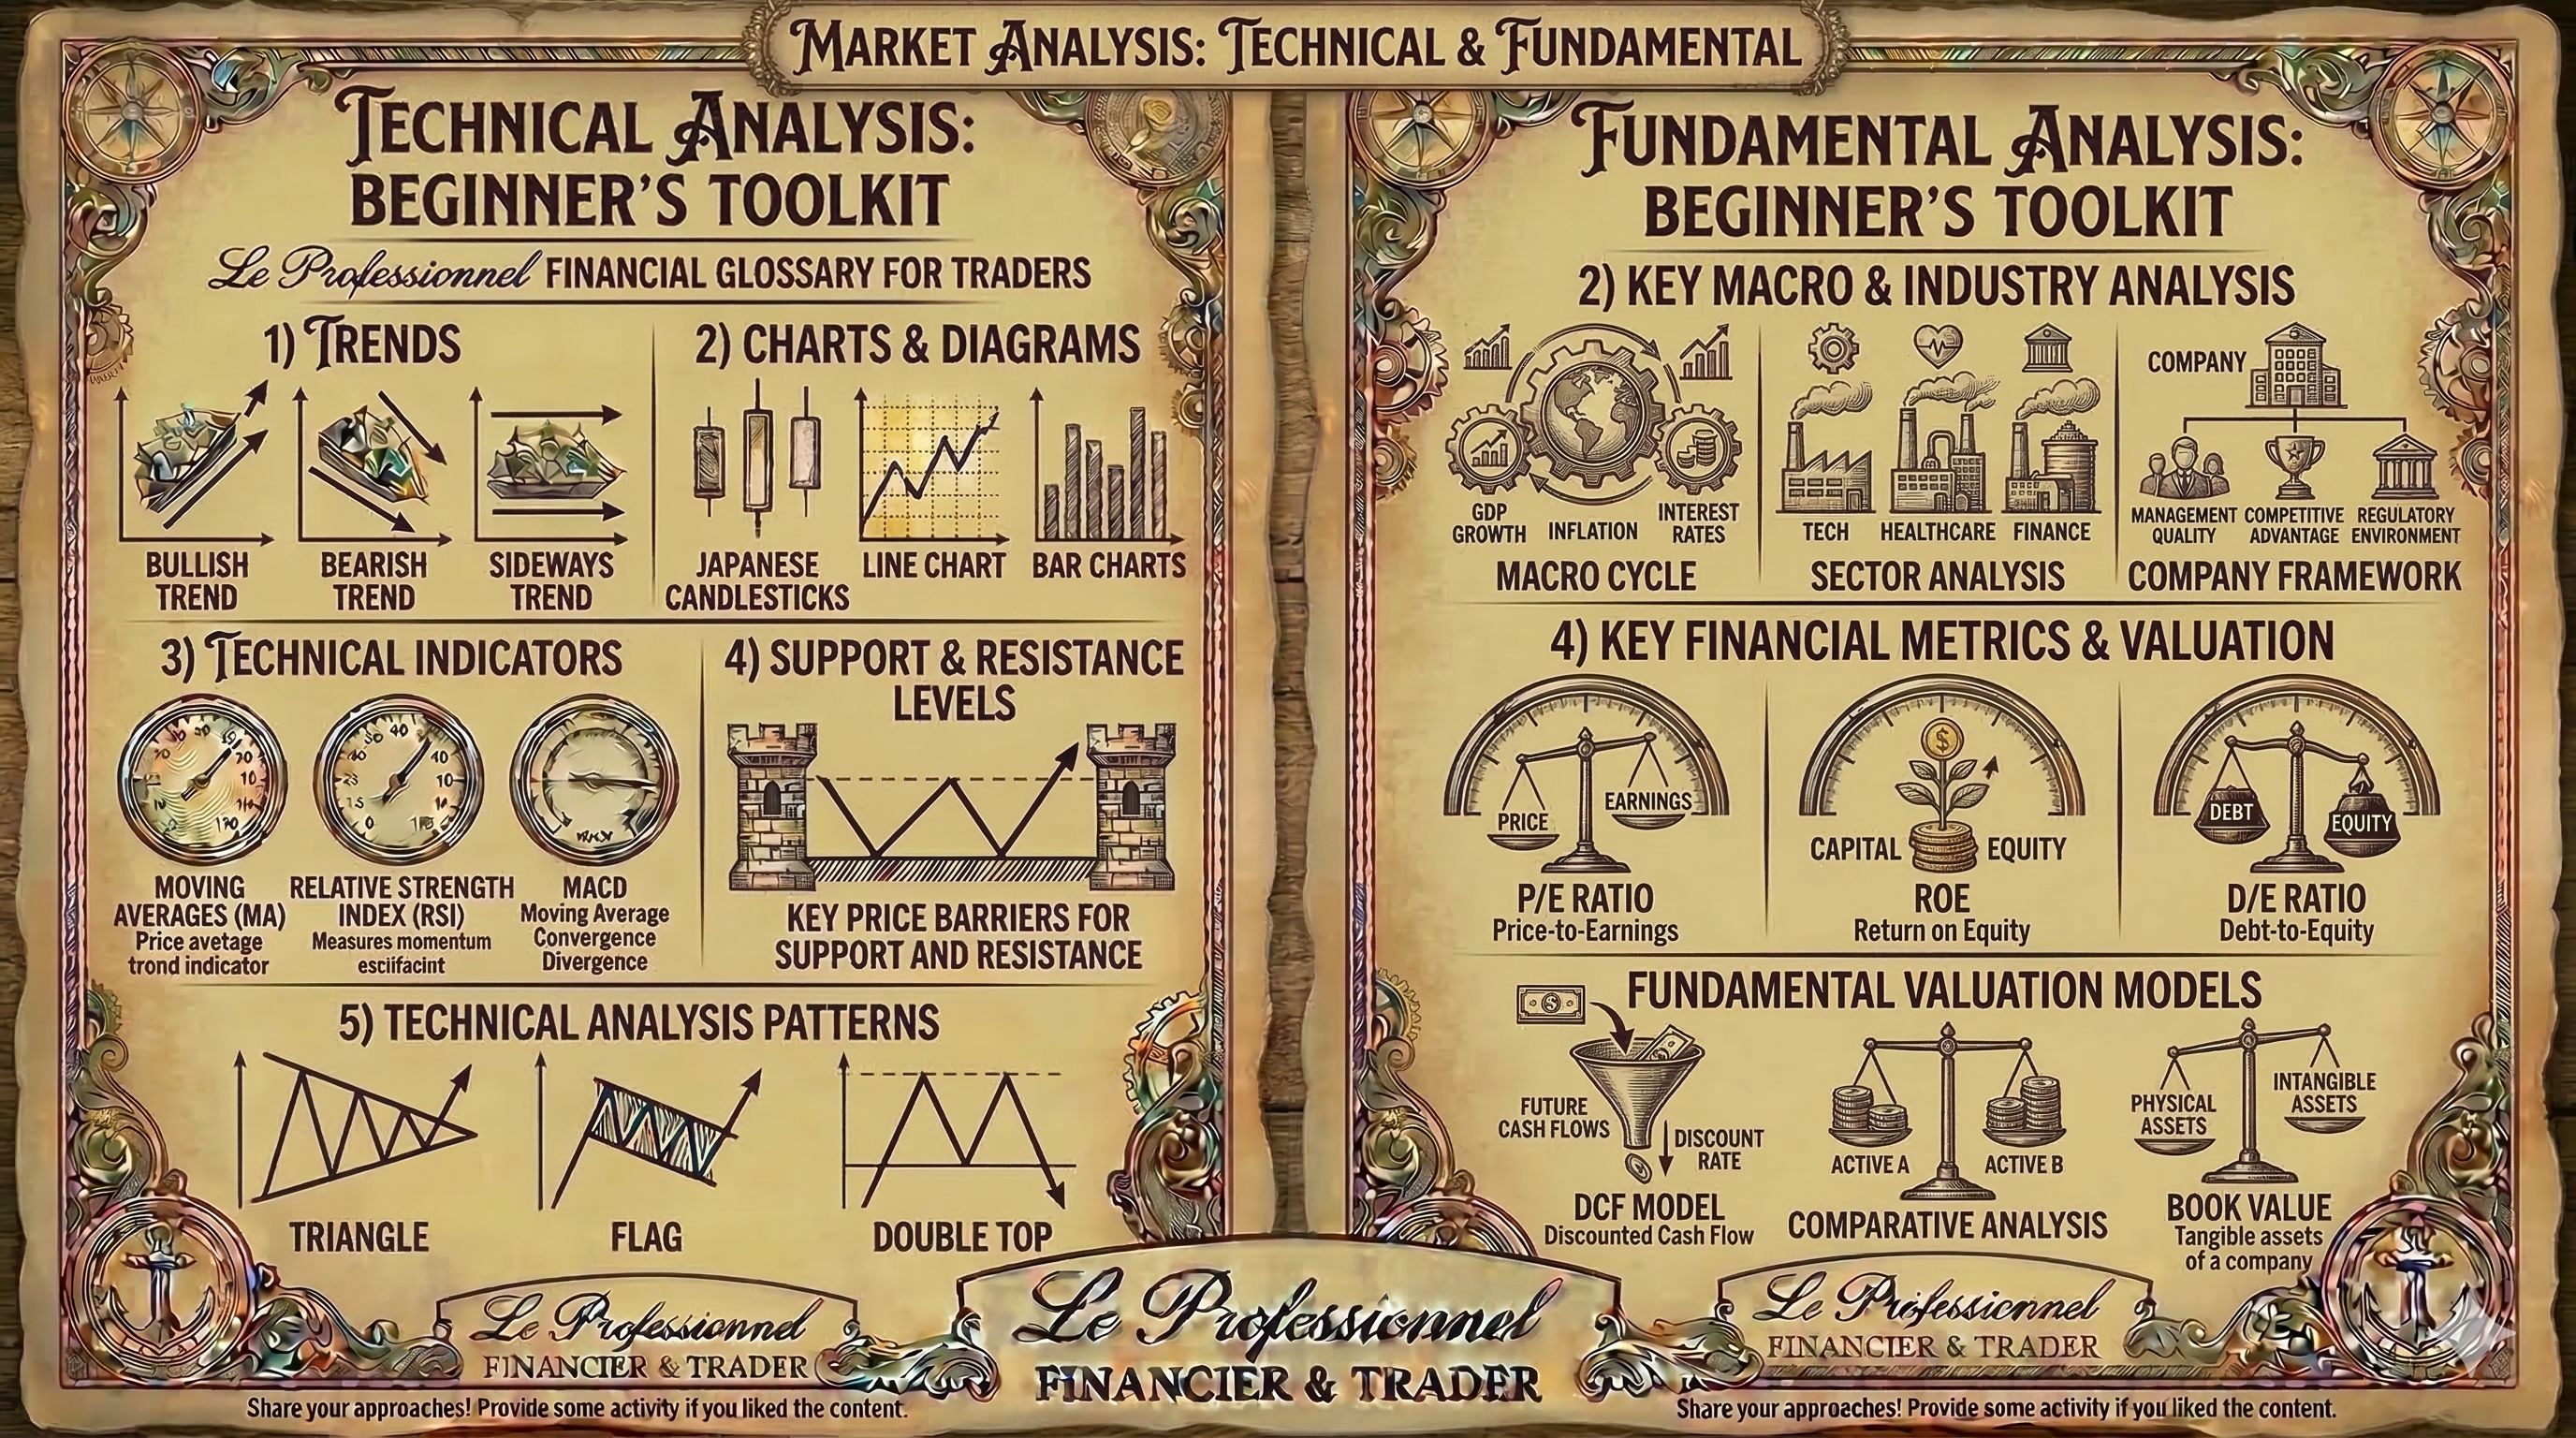
FA is a complex discipline that includes:
Macro (Economic): How does the global economy feel (inflation, rates, GDP)?
Sector (Industry): How is your fleet doing (competitors, technologies)?
Project/Crypto/Company Analysis: Who is at the helm (team), what is the utility of the project, what is the tokenomics?
Valuation (Assessment): Is the asset overvalued or cheap?
Pic. 2
🗺 Sea State Map: Simply Brilliant
Many seek complex schemes, but wisdom lies in simplicity. There are only 3 market states, 3 behaviors that constantly change into one another:
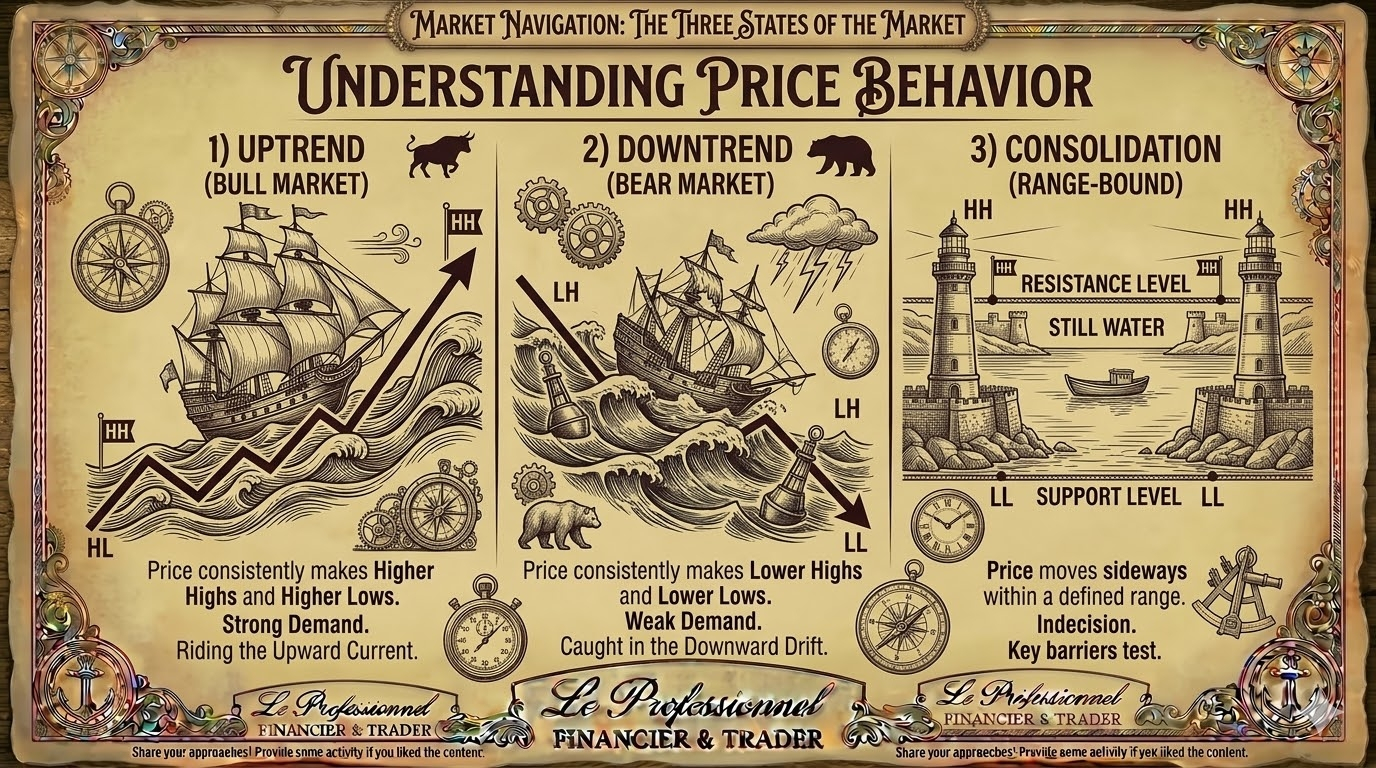
Growth (Uptrend): Bullish trend, when the ship sails upwards, updating local maxima.
Decline (Downtrend): Bearish trend, sinking into the abyss, updating local minima.
Consolidation (Range/Channel): Movement in a channel, bounded above and below. This is the time when the sea calms before a new storm.
🛠 Beginner's Navigation Toolkit (TA)
For successful Technical Analysis, you need a reliable set of tools:
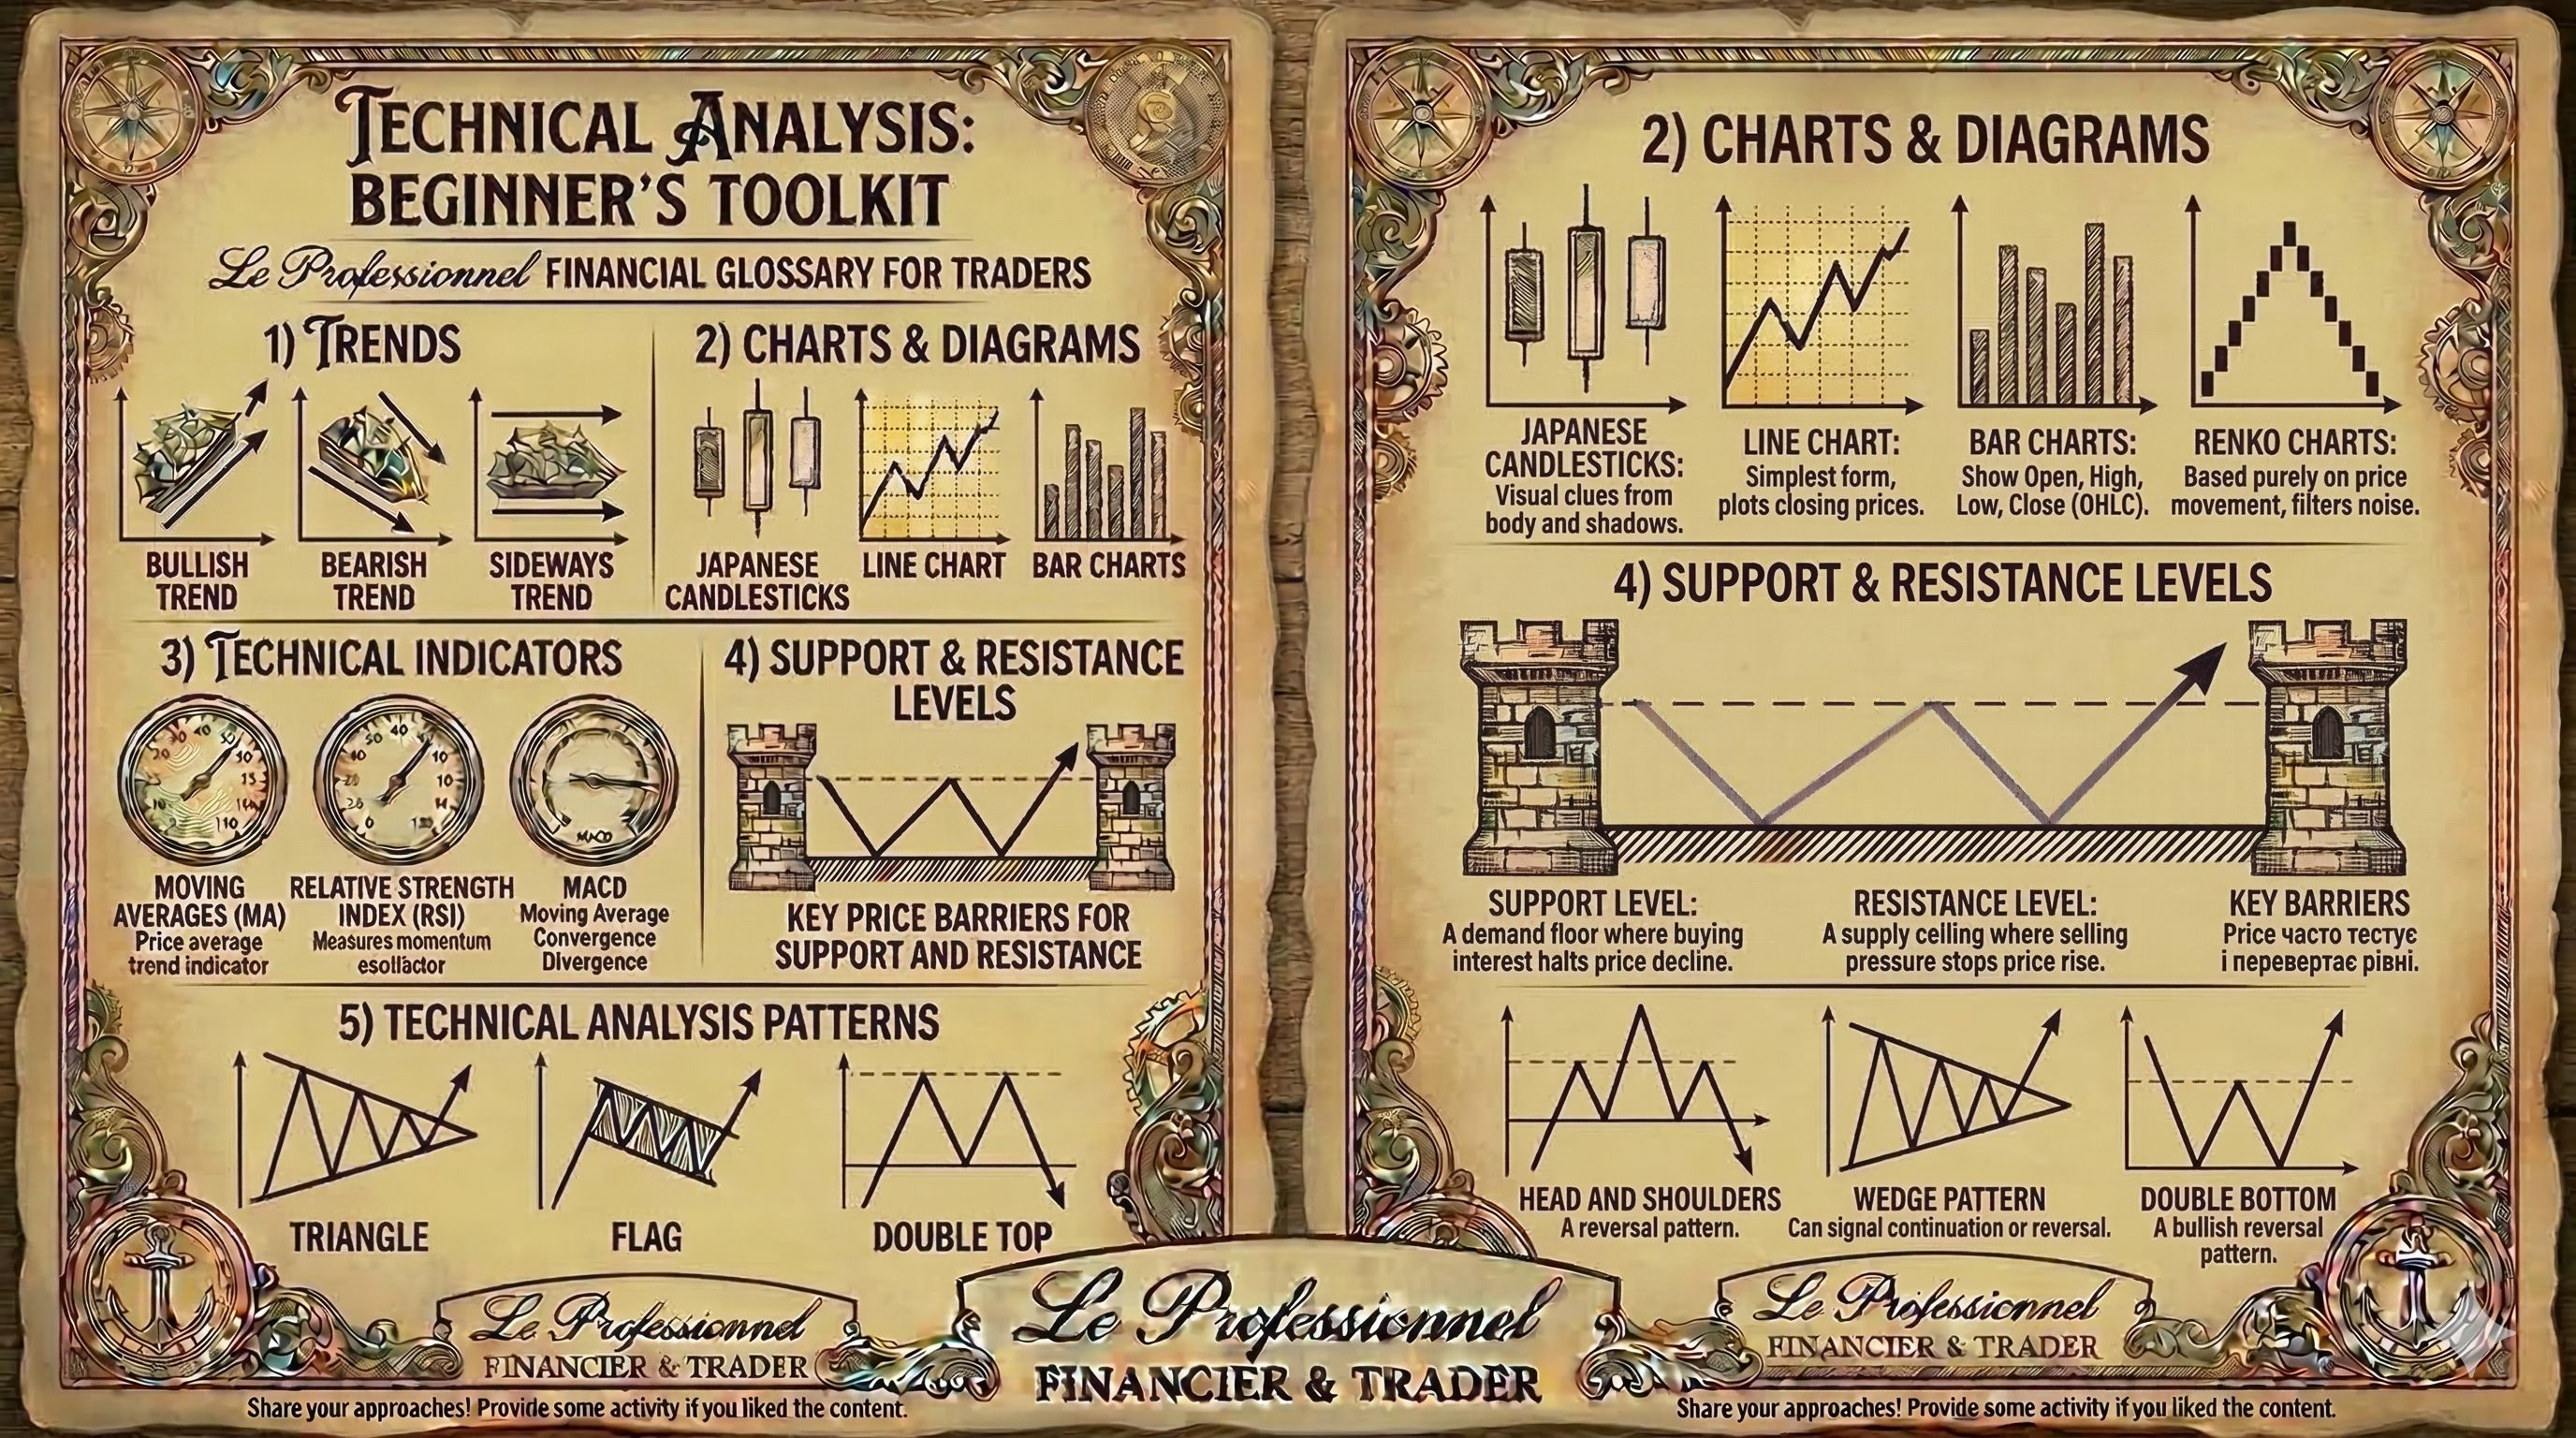
Trends: The overall direction of movement.
Charts (Japanese Candlesticks): Visualization of the battle of bulls and bears over time.
Technical Indicators (MA, RSI, MACD): Mathematical 'depth gauges' that show the strength of movement.
Support & Resistance: Key price levels where the price usually stops and changes direction.
Figures (Triangle, Flag, Double Top): Historical behavior patterns that often repeat.
Conclusion: There is no 'best' analysis. A true Captain uses both tools. TA shows when to raise the sails, while FA ensures you are buying valuable cargo and not a leaky barrel.
#LeProfessionnel #EducationalContent #BinanceSquare #CryptoAnalysis #Write2Earn