
The crypto markets have experienced a sharp and unexpected downturn, prompting traders to dive deep into Bitcoin price analysis ... to understand the reasons behind this sudden price collapse on the exchanges. Looking at the events, Bitcoin broke the crucial psychological support level at $70,000, impacted by two consecutive shocks within just a few hours. The first shock came from Strategy's ... announcement of selling 32 Bitcoin, marking the first move of its kind in nearly four years. Although the amount sold was relatively small, this move created a massive psychological earthquake among investors and the financial markets.
Moreover, the crisis has intensified due to the collapse of peace talks between the U.S. and Iran, increasing geopolitical tensions. Consequently, crude oil prices have risen, threatening to impose new inflationary pressures that could force the Fed to keep interest rates high and aggressive. As a result of this escalating fear, the market witnessed massive liquidations of leveraged positions exceeding $744 million within a 24-hour period. Similarly, alternative coins like Solana and Ethereum dropped by much larger percentages as investors preferred to exit quickly toward safe havens.
Accurate technical reading of Bitcoin's candlestick movement
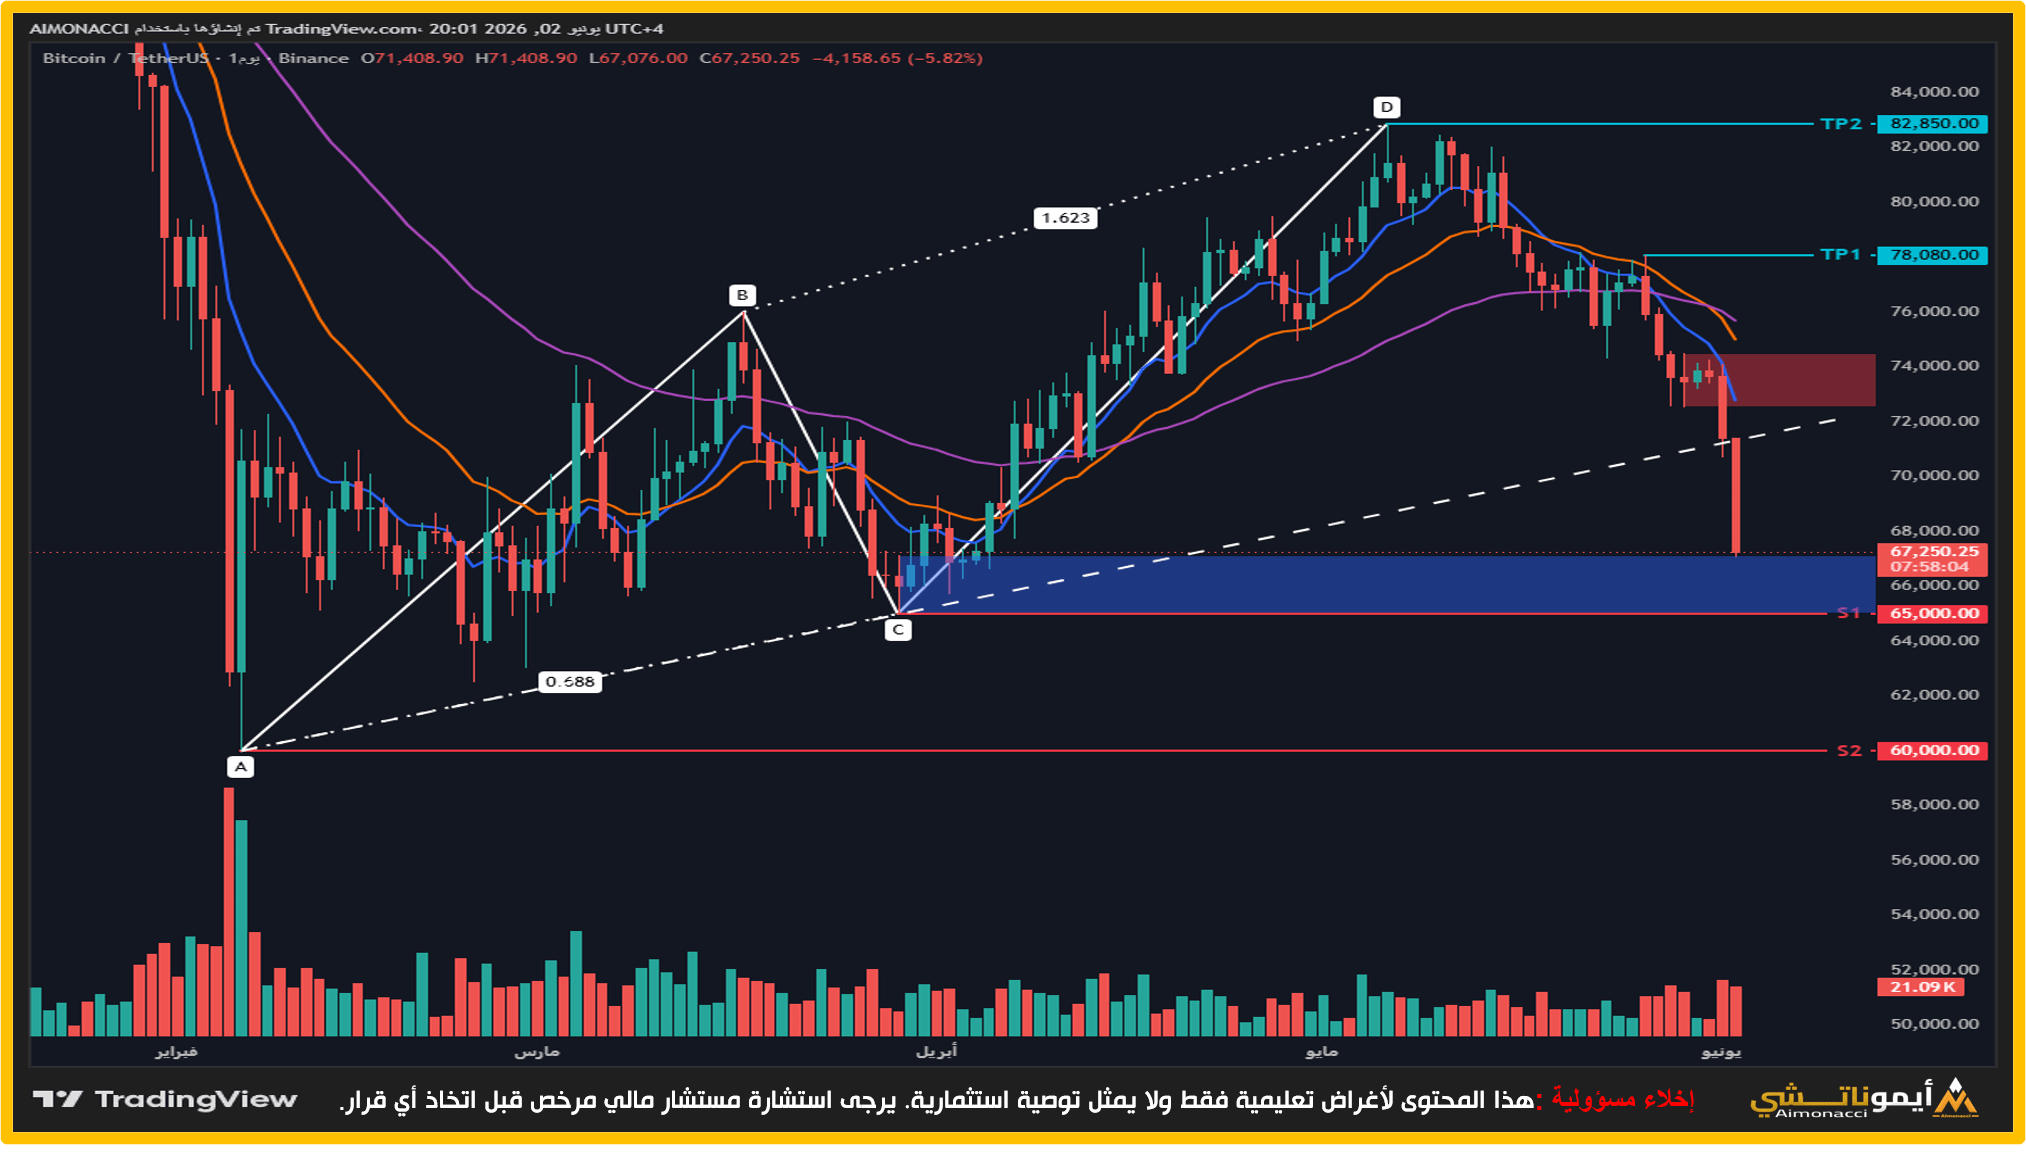
Shifting to the technical side, the analysis of Bitcoin's price relies on an accurate reading of the technical candlestick movement. Looking at the details, we observe that Bitcoin is currently trading directly at levels of $67,250 after a sharp and powerful daily bearish candle. The chart shows that the price broke the rising trend line defined by the dotted white line, which was a major protective barrier for the path. Based on this behavior, the price has officially entered the shaded blue area below, reflecting increasing direct selling pressures currently.
On the other hand, the red lines highlight the remaining key support levels to protect the price from further sharp price slips. The first support level 'S1' stands at $65,000, followed by the second, stronger technical support level 'S2' at $60,000. Conversely, previous support areas have turned into strong resistance levels starting from $70,000 up to the area shaded in red.
When reading the harmonic pattern shown by the white lines, we find that the price completed its bullish wave at point 'D' near the peak of $82,850. However, the lack of sufficient buying liquidity caused a rapid pullback to retest the stable bottom at point 'C', which is at the current support levels. Based on this technical setup, Bitcoin needs to stabilize above the $65,000 level to prevent triggering bearish scenarios toward distant bottoms. Here, the critical importance of monitoring price behavior and current trading volume at these vital levels illustrated in the daily chart becomes clear.
Advanced technical indicators analysis and liquidity trends
Using moving averages contributes to enhancing the analysis of Bitcoin's price to understand the depth and strength of the prevailing bearish trend in the markets. The fast moving average shown in blue indicates a sharp downward trend, clearly reflecting the complete dominance of the bears in the current trading activities. Additionally, the orange moving average is positioned above the current price, forming a dynamic barrier with the purple moving average that prevents any near-term bullish attempts. Hence, these indicators collectively act as moving resistances that pressurize prices and continuously push them to test previous lows during the current time for the asset.
As a result of this negative behavior, the Volume indicator at the bottom of the chart shows a significant increase in the recent red selling bars. This increase reflects strong outflow liquidity indicating a state of panic and forced selling of long-term buy contracts on the platforms. However, technical estimates suggest that the price is approaching oversold areas that may grant the markets some temporary calm. Therefore, investors are looking to monitor the upcoming daily closes to verify the resilience of the specified historical support levels against this violent wave.
Alongside the moving averages, technical data shows that breaking the dotted white trend line could change the bullish wave outlook for the medium term. However, the stability of the $65,000 support level represents the last opportunity to rebuild new buying positions for the bulls. Furthermore, tracking institutional liquidity helps reveal whale movements and whether they are taking advantage of the drop for silent accumulation at current prices. As a result, technical analysis experts advise avoiding random entry with high leverage and waiting until momentum indicators stabilize safely and accurately.
Expected scenarios and probability of future Bitcoin price movement
Based on current technical and fundamental data, the upcoming analysis of Bitcoin's price hinges on two crucial points of utmost importance for traders. First, the likely scenario involves continued negative volatility and a precise retest of the strong support level 'S1' at a price of $65,000. As a result, the markets may experience a long and difficult sideways accumulation phase aimed at absorbing the selling pressures caused by the liquidation of futures contracts. If buyers succeed in maintaining this level, we will see a rebound targeting a return above the $70,000 levels again.
Secondly, the alternative scenario involves the price breaking below the $65,000 level and closing daily beneath it with a high and concerning selling volume in the markets. In this case, the path directly opens for Bitcoin to drop toward the second major support level 'S2' at $60,000. Therefore, we advise all traders to strictly adhere to risk management rules and avoid using high leverage during these tough times.
In conclusion, we see that restoring the bullish trend requires stabilization of geopolitical conditions and the release of economic data that supports a reduction in U.S. interest rates soon. But until that happens, caution remains the best option while closely tracking the accompanying candlestick chart.
We present this comprehensive analysis to assist you in making wise decisions, wishing you successful and profitable trades always with the Ichimoku Academy.